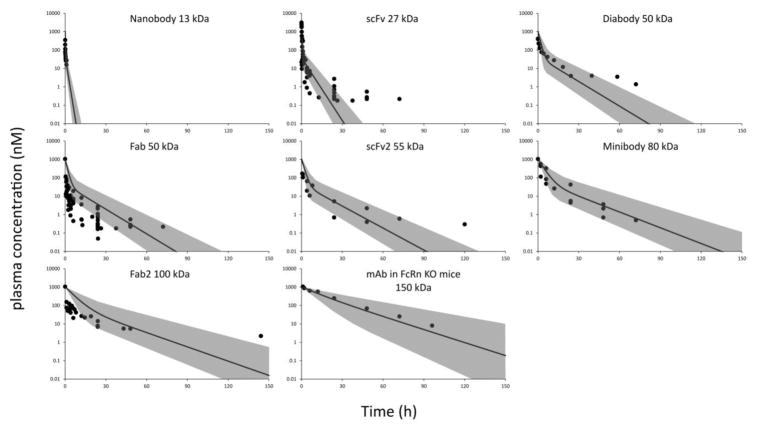
Figure 3.
Observed and model predicted PK profiles for nanobody (13 kDa), scFv (27 kDa,), diabody (50 kDa), Fab (50 kDa), scFv2 (55 kDa), minibody (80 kDa), F(ab)2 (100 kDa), and IgG in FcRn KO mice (150 kDa). Solid circles represent digitized raw PK data, and solid lines represent 2-compartment model fitted PK profiles. The gray area represent the zone obtained by changing the systemic clearance two-fold.

