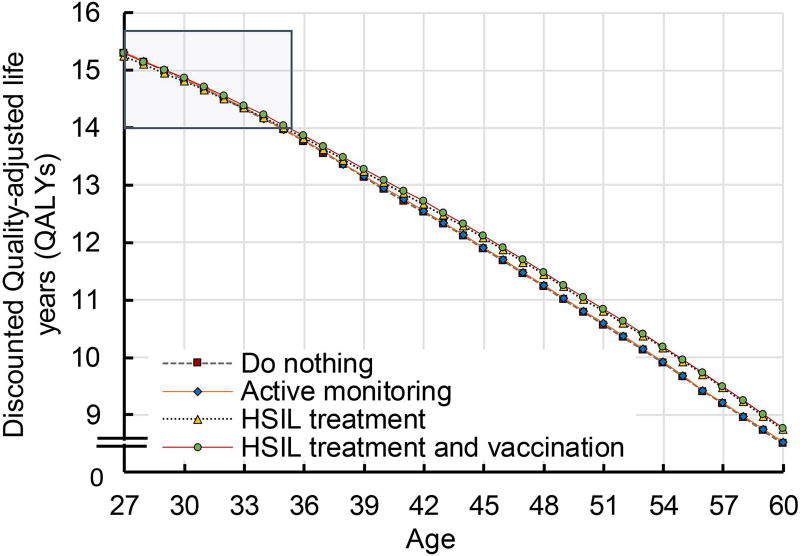
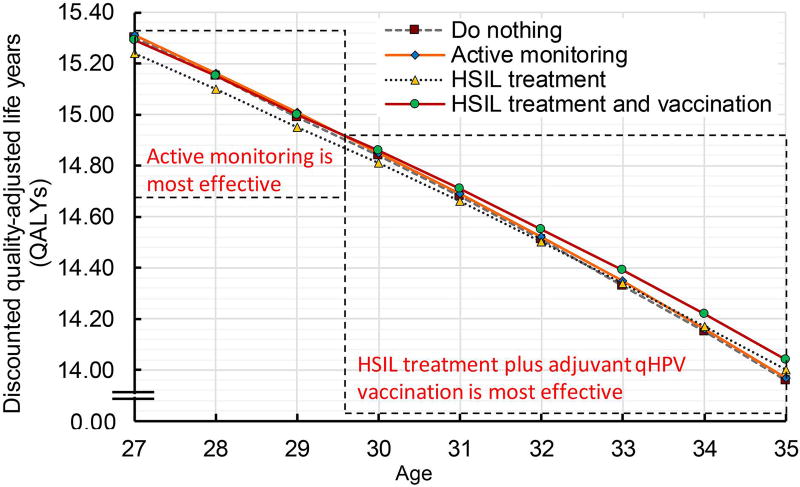
Figure 2. Clinical effectiveness by age.
a shows quality-adjusted life expectancy by HSIL management strategies and age. The strategies (i) do nothing, (ii) active monitoring, (iii) HSIL treatment, and (iv) HSIL treatment plus adjuvant qHPV vaccination are represented by the lines dotted grey, dashed orange, dotted blue, and dashed red. The QALYs reported using an annual discount rate of 3%.
b shows quality-adjusted life expectancy by HSIL management modalities in patients 27–35 years of age (magnified version of Figure 2a). The strategies (i) do nothing, (ii) active monitoring, (iii) HSIL treatment, and (iv) HSIL treatment plus adjuvant qHPV vaccination are represented by the lines dotted grey, dashed orange, dotted blue, and dashed red. The QALYs reported using an annual discount rate of 3%.


