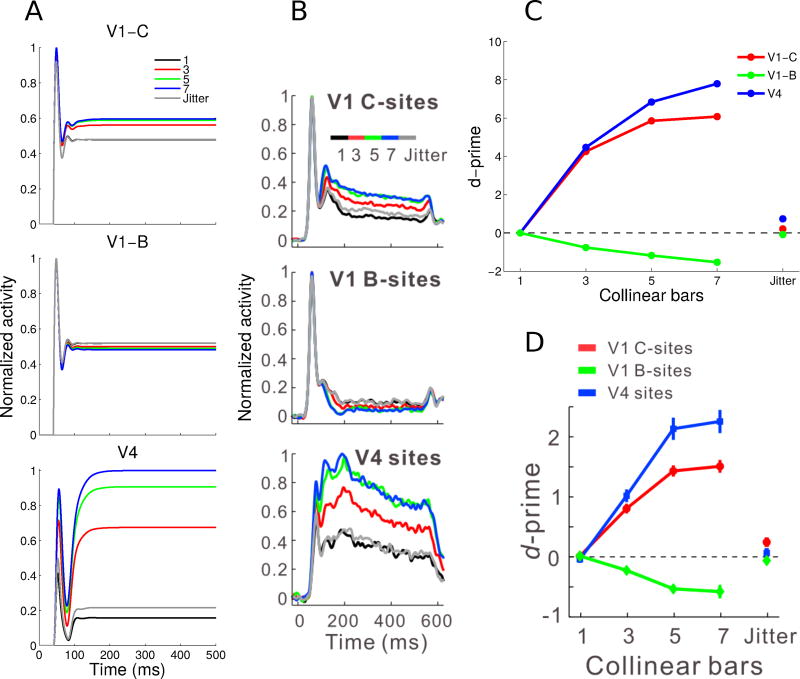
Fig. 4.
Normalized V1 E cell (contour and background sites) and V4 Gc cell neuronal activity and contour-response d′ to contours of varying lengths. (A) V1 contour (top) and background (middle) sites and V4 sites (bottom) showed facilitation followed by saturation with increasing contour length (see legend). V1 background sites showed greater suppression with longer contours. The jitter condition involved a 7-bar pattern where each bar was laterally offset to disrupt collinearity. (B) Corresponding experimental results showing normalized and averaged PSTHs from the Chen et al (2014) study. (C) Contour-response d′ was higher for the V4 sites compared to the V1 contour sites, and was facilitated by increasing contour length. V1 background sites had increasingly negative d′ with longer contours, indicating background suppression. The jitter condition reduced the absolute value of the d′ values to close to zero, making it similar to the baseline noise condition. (D) Corresponding experimental observations, showing the mean contour-response d′ from the Chen et al (2014) study. Panels B and D are modified from Figure 2 of Chen et al (2014). All model results (Panels A and C) are averages for a single neuron over 100 simulations.

