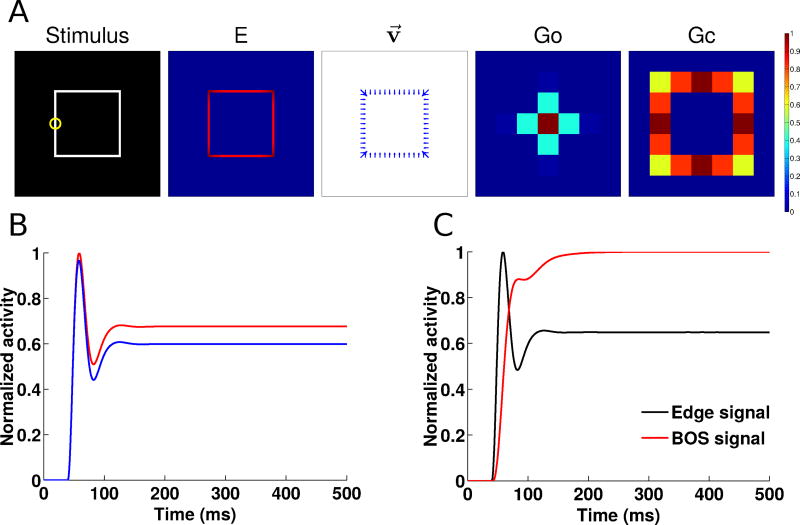
Fig. 6.
Figure-ground segregation of a square object as in the Zhou et al (2000) experiments. (A) Shown left to right are the input stimulus, the edge cell activity (E), the border ownership assignment along edges (shown as the vector modulation index v⃗, section 2.5), the object grouping neuron activity (Go) and the contour grouping activity (Gc). Activities are normalized within each map, and warmer colors indicate higher activity (see color bar at right). (B) Time course of normalized border-ownership cell activity for the preferred side-of-figure (red) and non-preferred side-of-figure (blue) for the receptive field marked by the yellow circle in panel A. Here, the preferred side-of-figure is to the right. (C) Timing of the normalized border-ownership signal (red) and the edge signal (black). The BOS signal is defined as the difference in activities of the two opposing pairs of border-ownership cells in panel B. The edge signal is defined as the sum of the activities of the two border-ownership cells. The curves are normalized to the same scale (0–1) to show the time course of the responses.

