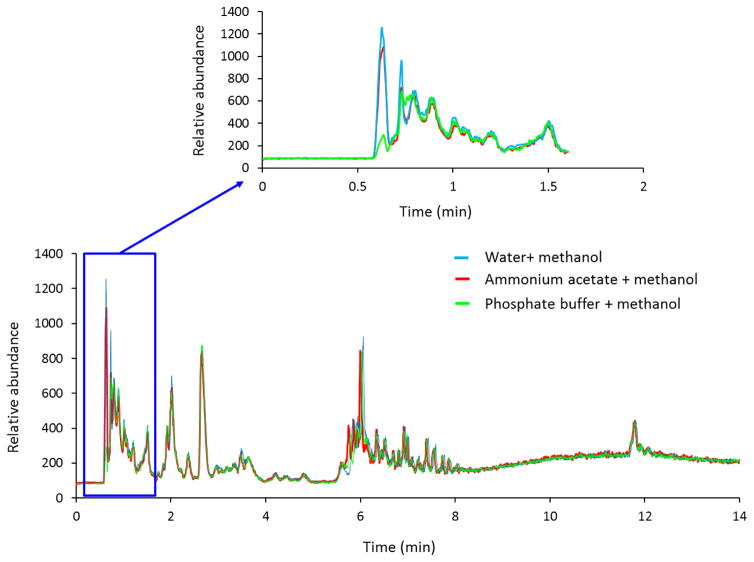
Fig. 2.
An overlapping comparison of the representative TIC pattern. An ammonium acetate methanol (AAM) and water methanol (WM) extraction method gives better detection of molecular features over phosphate buffer methanol (PM) extraction method. An overlapping comparison of the TIC patterns for soy leaf tissues using AAM (red), WM extraction (blue), or PM (green), plotted as a function of ion intensities with retention time.

