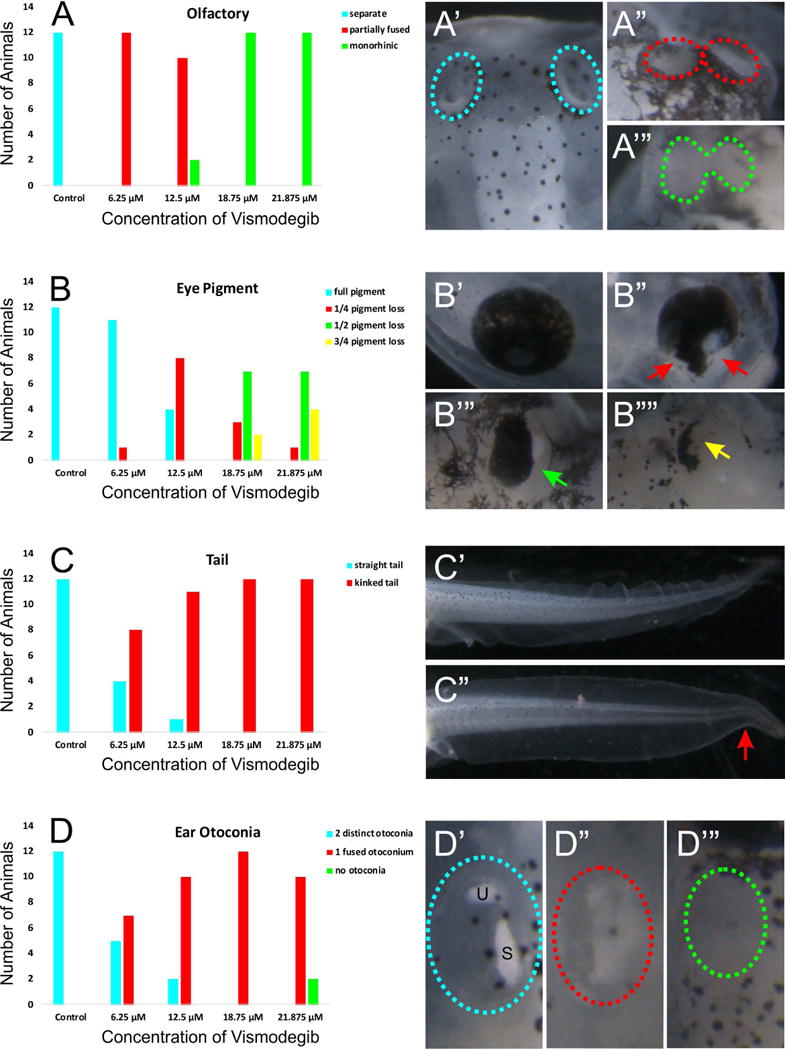
Figure 1. Varied concentrations of Vismodegib result in a dose-dependent effect on phenotypic changes.

A) Control tadpoles display two distinct olfactory groves (A’). However, increasing Vismodegib concentration results in an increasing tendency towards complete fusion of the two groves (A”-A”’). Animals treated with 6.25 μM Vismodegib exhibited partially fused olfactory epithelia (A”). By 18.75 μM of Vismodegib, all animals exhibited complete fusion of the olfactory epithelia (A”’). B) Eye pigmentation was also affected following treatment with Vismodegib. Compared to control animals which exhibited full eye pigmentation (B’), animals treated with 6.25 μM Vismodegib began to lose eye pigmentation in the ventral part of the eye (B”). This loss of ventral eye pigmentation was more profound in animals treated with 12.5 μM Vismodegib. About half of animals treated with 18.75 μM had pigment loss in half of the ear (B”’). In a couple animals treated with 18.75 μM and about one third of animals treated with 21.875 μM Vismodegib had very little eye pigment remaining (B””). C) Tail development was variably affected as a result of reduced Shh signaling. Animals treated with 12.5 μM, 18.75 μM, and 21.875 μM Vismodegib exhibited a kink at the caudal portion of their tails (C”) compared to the straight tail of control animals (C’). At 6.25 μM Vismodegib, fewer animals exhibited kinked tails. D) Aberrations in otoconia development were also evident with Vismodegib treatment. Control tadpoles had two distinct otoconia (D’). Some animals treated with 6.25 μM Vismodegib, most animals treated with 12.5 μM Vismodegib, and all animals treated with 18.75 μM Vismodegib had a single otoconia mass (D”). A couple animals treated with 21.875 μM lacked otoconia formation altogether (D”’), whereas the rest had one otoconia mass (D”).
