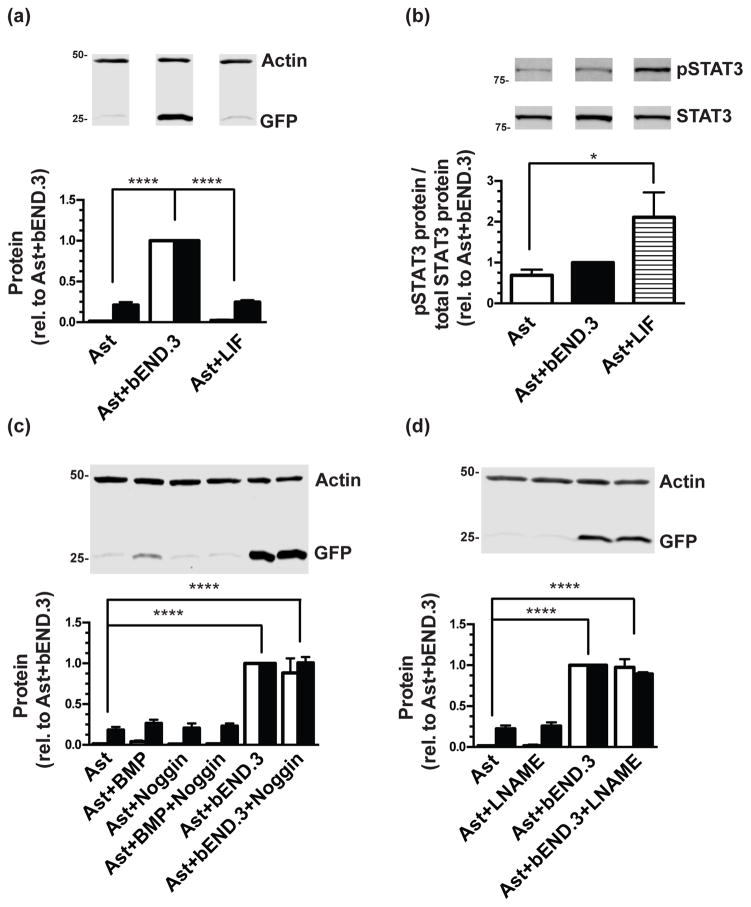
Figure 4. Effect of LIF, BMP2, or L-NAME treatment on eGFP and GLT-1 protein levels.
Cortical astrocytes from dual reporter mice were either co-cultured with bEND.3 cells or treated with leukemia inhibitory factor (LIF), and then harvested for Western blot analysis of eGFP (Top: representative blot, Bottom: white bars) and GLT-1 (Bottom: black bars) (a) or STAT3 and pSTAT3, where pSTAT3 is normalized to total STAT3 levels (b). Data are the mean ± SEM of four independent experiments. Other astrocytes were treated with bone morphogenic factor 2 (BMP-2), Noggin, or both, with or without co-culture with bEND.3 cells as indicated (c), or L-NAME, with or without co-culture with bEND.3 cells as indicated (d) and harvested for Western blot analysis. Blots were probed for eGFP and GLT-1. Top: Representative eGFP blots and Bottom: summary of quantification of both eGFP (white bars) and GLT-1 (black bars), normalized to β-actin. Data are the mean ± SEM of three independent experiments. * p ≤0.05, **** p ≤ 0.0001 for indicated comparisons.

