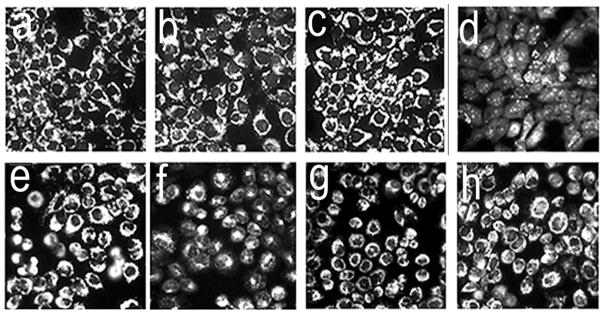
Figure 3.
Effects of individual photosensitizers and the sequential PDT protocol on ΔΨm in 1c1c7 (a–d) and A549 (e–h) cells. Light doses are described in the legend to Fig. 1. Fluorescent probe, MTO (sensitive to the mitochondrial membrane potential). Images were acquired directly after irradiation. These represent typical results from three independent experiments. Panels: a,e = controls; b,f = BPD PDT; c,g = NPe6 PDT alone; d,h = NPe6 PDT followed by BPD PDT.

