
Fig. 5.
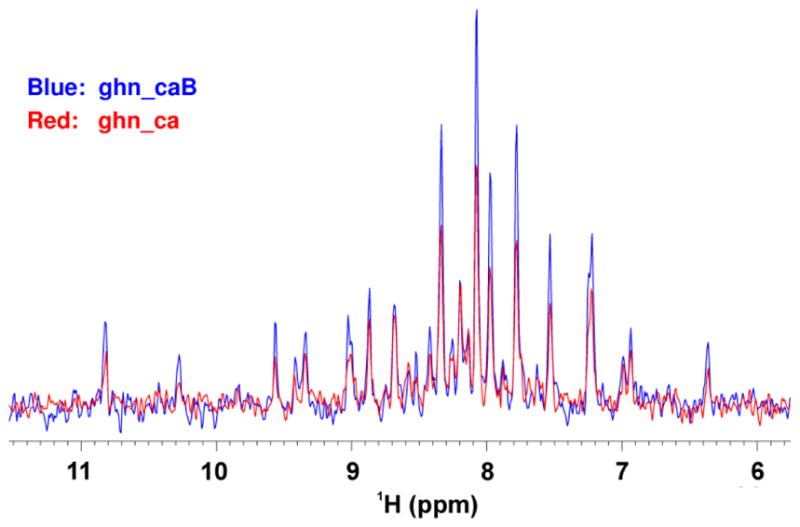
Comparison of the 1D traces extracted from the first 2D H-C planes of the 3D TROSY-HNCA spectrum acquired on a Varian 800 MHz spectrometer with two pulse sequences: ghn_ca and ghn_caB, reported in Fig. S2 and Fig. S3, respectively. Acquisition parameters: recycle delay d1 was 2 s, the number of scans was 128, and 64 complex points in the 13C dimension were used.