
Fig. 8.
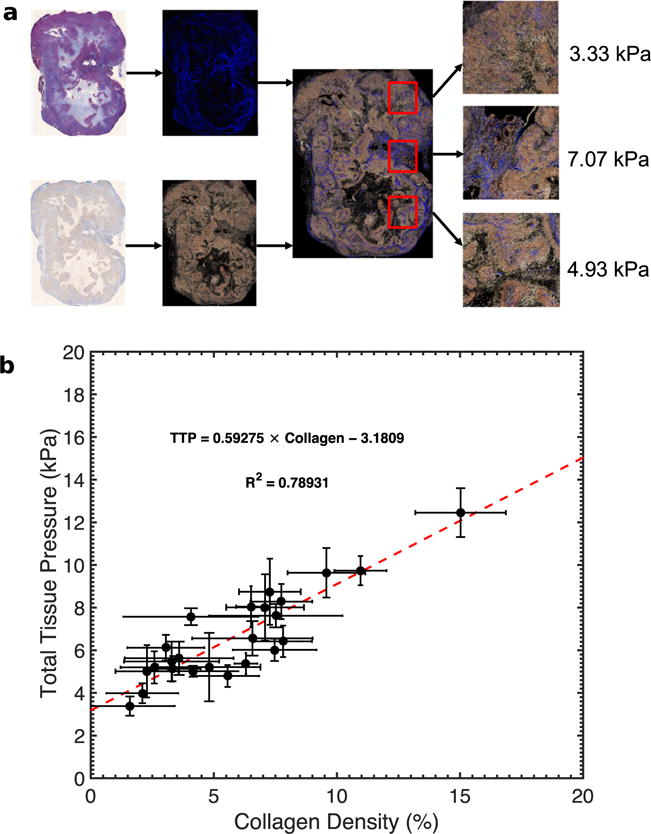
(a) Total tissue pressure within an orthotopic tumor measured at regions with different collagen (blue stains) distributions. (b) Scatterplot of tissue pressure versus collagen density within AsPc-1 tumors (n = 24). We calculated the mean pressure from 10 statistically independent points within each tumor.