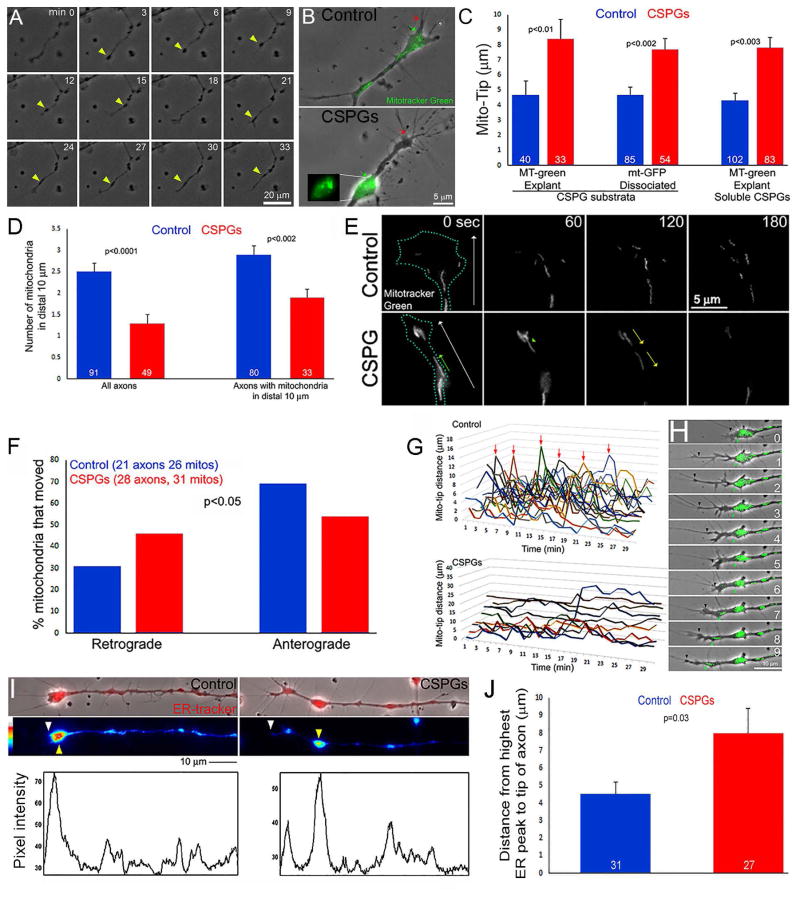
Figure 1.
CSPGs impair the targeting of mitochondria and the ER to the distal axon. (A) Example of the dynamics of axons on CSPGs. Varicosities formed along the distal axon that subsequently underwent retrograde displacement (yellow arrows). Although periods of growth cone elaboration were observed (e.g., 15–24 min) the axon failed to advance significantly. (B) Example of localization of mitochondria (green; distal most denoted by green arrow) relative to the distal most axon (denoted by red arrow) in dissociated neurons. The inset shows the accumulation of mitochondria in a varicosity proximal to the axon tip. (C) Quantification of the number of mitochondria in distal axons of dissociated neurons. Bars on right show analysis considering only axons with mitochondria targeted to distal 10 μm in both control and CSPG groups. (D) Quantification of Mito-Tip under different culturing conditions, on CSPG substrata or treatment with soluble CSPGs (20 mg/mL, 1 hr), and labeled with mitotracker green (MT-green) or genetically encoded GFP targeted to mitochondria (mt-GFP). (E) Example of timelapse imaging of mitochondria in distal axons of dissociated neurons. White arrows in first panels denote distal and the blue dots the outline of the growth cones (time in sec). In CSPG panels, green arrow denotes a mitochondrion which moved distally, and yellow arrows denote retrograde movement of mitochondria away from the axon tip. While the number of mitochondria increased in the control axon, 2/3 of mitochondria evacuated on CSPGs. (F) Quantification of the percentage of mitochondria that underwent net retrograde or anterograde/distal movement during the imaging periods (360 sec, 10 sec intervals). (G) Measurements of Mito-Tip from dual channel phase contrast and green movies. Note that the Y-axis has approximately twice the range for the CSPG group relative to the control due to the increase Mito-Tip measurements in the former. Each line represents one axon. Arrows denote brief periods of increased Mito-Tip in controls. (H) Example of intermittent increase in Mito-Tip in control axons. Between 0–6 min the axon advances but the mitochondria do not. At 7–9 min some of the mitochondria advance and return in proximity to the tip of the axon. (I) Examples of ER Tracker labeled axons and line scans. White and yellow arrowheads denote distal axon tip and accumulation of ER. Line scans of the intensity of ER-tracker labeling along the axons are shown below the images. The tip of the axon and the distal-most highest peak of labeling intensity are denoted by white and yellow arrows, respectively. (J) Quantification of the mean distance between the axon tip and the distal-most highest peak of ER-tracker staining intensity.

