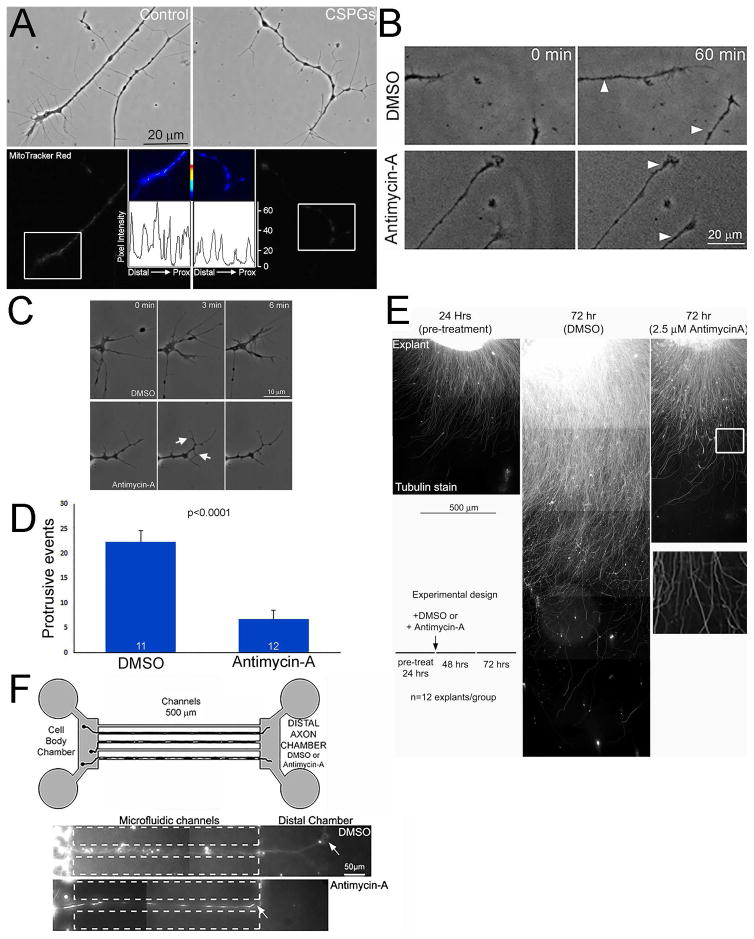
Figure 4.
Inhibition of mitochondria membrane potential to a similar extent as observed on CSPGs impairs axon extension and growth cone protrusive dynamics. (A) Examples of axons stained with mitotracker red. Top panels show phase contrast images of axonal morphology on control and CSPG coated substrata. Bottom panels show the mitotracker red grayscale staining intensity. The false colored insets show the distal most mitochondria (shown in white boxes in the gray scale images). Line plots of mitotracker red intensity are shown below each of the false colored insets. (B) Examples of the extent of axon extension on the control substratum following a 30 min treatment with either DMSO of 2.5 μM antimycin-A. The white arrows in the 30 min panels show the position of the growth cone at time 0. (C) Examples of growth cone dynamics in DMSO and Antimycin-A treatment conditions. The control DMSO treated growth cone exhibits many protrusions. Antimycin-A treatment suppresses protrusive activity, but as denoted by the arrows some degree of protrusion persists. (D) Quantification of the total number of protrusive events at growth cones (lamellipodia or filopodia) in DMSO and Antimycin-A treated samples during a 6 min imaging period starting at 30 min post-treatment. (E) Examples of the extent of axon extension on the control substratum at 24 hrs and 72 hrs representing pre-treatment (24 hrs) and 48 hrs post-treatment with either DMSO or 2.5 μM antimycin-A. The schematic shows the time course of the experiment and treatments. Note that the DMSO treated control (72 hrs) exhibits axons much longer than the 24 hr pre-treatment example. In contrast, the antimycin-A treated example (72 hrs) shows minimal advance of axons beyond the extent evident at 24 hrs. The boxed region in the antimycin-A panel is magnified below showing that the axons do not exhibit signs of degeneration and maintain a uniform linear morphology, as revealed by tubulin staining. (F) The schematic shows the setup of the microfluidic chambers. The examples below show axons that extended through the channels and into the DMSO containing distal axon chamber in the control group and stalled at the entry of the distal axon chamber containing antimycin-A. Samples sizes are denoted in the bars.

