Figure 6.
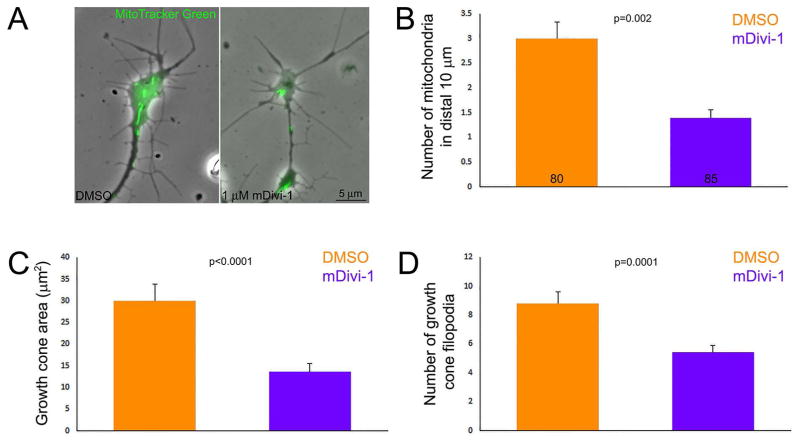
Decreasing the number of mitochondria at the growth cone affects growth cone morphology. (A) Examples of growth cones treated with DMSO or 1 μM mDivi-1 for the entirety of the culturing period. Phase contrast with over-layered mitochondria (green) is shown. Note the simplification of growth cone morphology in the mDivi-1 treatment condition. (B) Graph of the number of mitochondria in growth cones as a function of DMSO or mDivi-1 treatment. The color scheme and sample sizes also apply to panels (B–C). (C) Graph of growth cone area as a function of DMSO or mDivi-1 treatment. (D) Graph of the number of filopodia present at growth cones as a function of DMSO or mDivi-1 treatment. Samples sizes are denoted in the bars of panel B and apply to B–D.

