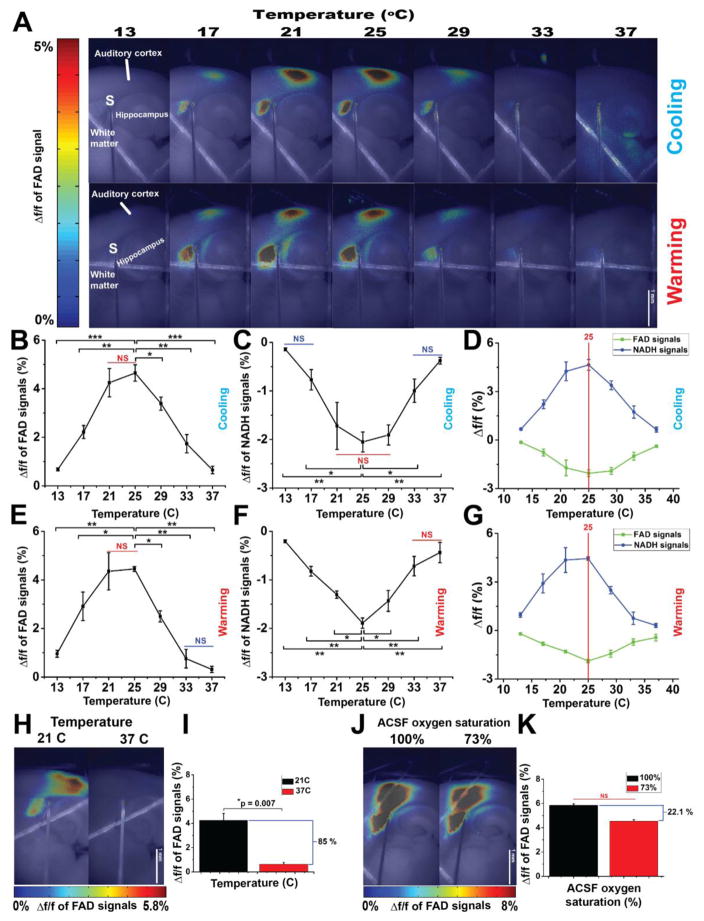
Figure 2. The metabolic signals associated with synaptic activity is a temperature-dependent.
A) Pseudocolor heat map of the average intensity of the Δf/f of FAD signals evoked by the electrical stimulation of subcortical white matter of auditory thalamocortical brain slice at different temperatures under cooling (top panel) and warming (bottom panel); S: Site of stimulating electrode; B and E) Line plots between temperature (x-axis) and Δf/f of FAD signals associated with synaptic activity (y-axis) under cooling and warming, respectively; C and F) Line plots between temperature (x-axis) and Δf/f of NADH signals associated with synaptic activity (y-axis) under cooling and warming, respectively, D and G) Merged plots of Δf/f of both FAD and NADH under cooling and warming, respectively, red line shows the maximum values of Δf/f of both signals; H and J) Pseudocolor heat map of the average intensity of the Δf/f of FAD signals associated with synaptic activity at (21 vs. 37°C) and at (100 vs. 73%) oxygen saturated ACSF, respectively; I) Bar plots of Δf/f of FAD signals associated with synaptic activity at 21°C (black bar) vs 37°C (red bar); K) Bar plots of Δf/f of FAD signals associated with synaptic activity under 100% (black bar) vs 73% (red bar) oxygen saturated ACSF at 21°C; N = 4 (one slice per mouse); Post hoc, *vs 25°C (0.05>p>1×10⁻⁴), **vs 25°C (1×10⁻⁴>p>1×10⁻⁷), ***vs 25°C (1×10⁻⁷>p>1×10⁻⁹); NS: non-significant difference between temperatures covered with a solid line.

