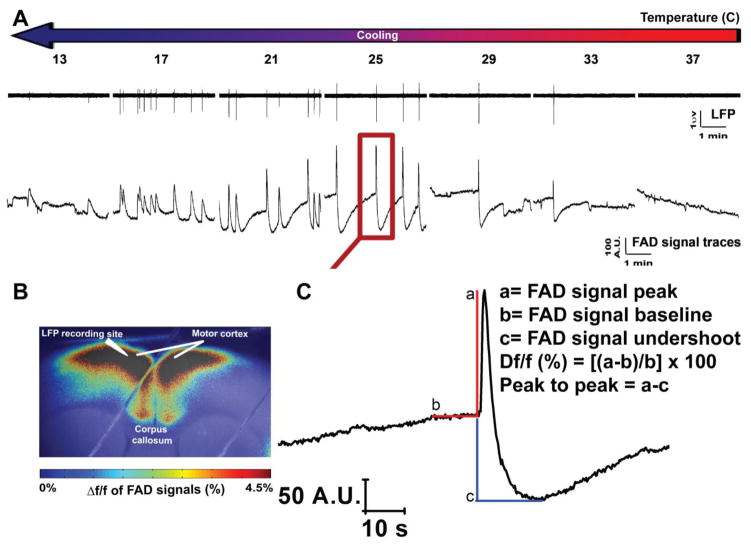
Figure 4. Simultaneous measurement of LFP and FAD signals of SPD events occurring in the presence SR-95531 at different temperatures.
A) Time traces of LFP (top panel) and those of FAD (bottom panel) signals associated with the SPD events in cortical layer 2/3 occurring in the presence of 4 μM of SR-95531 at different temperatures; B) Pseudocolor heat map of the average intensity of the Δf/f of FAD signals associated with SPD events; C) Expansion of one FAD signal from FAD trace at 25°C on panel A (red square) giving an expanded view for the different quantified components of FAD signal used for the analysis.

