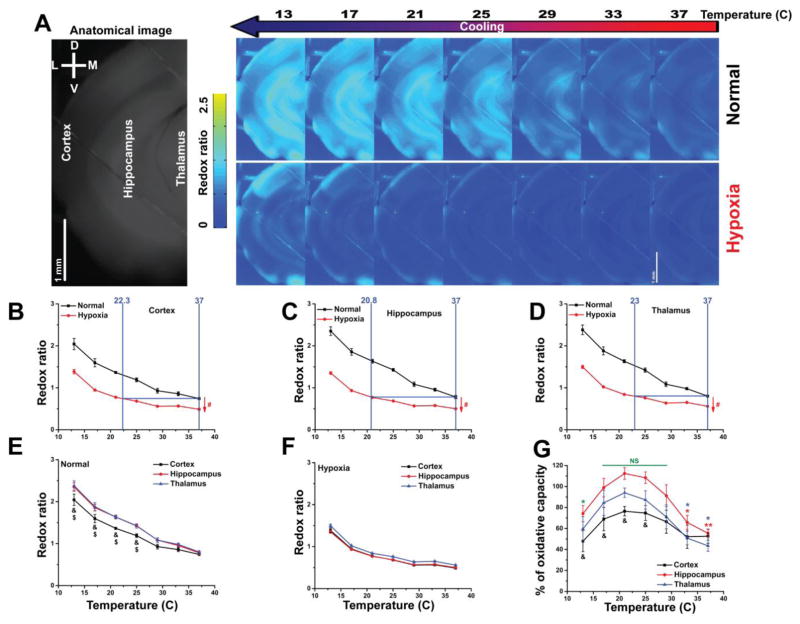
Figure 7. Hypothermia normalizes the oxidative states of the brain slice under hypoxia.
A) Pseudocolor heatmaps of a coronal brain slice showing the change of the redox ratio of the tissue under hypoxia (bottom panel) versus normal condition (top of panel); B–D) Merged plots of the redox ratios of cortex, hippocampus, and thalamus, respectively, under normal vs hypoxia with temperature; The quantification of redox ratios of the three brain structures under hypoxia. E) Line plots between temperature (x-axis) and redox ratio (y-axis) of different brain structures under normal condition; F) Line plots between temperature (x-axis) and redox ratio (y-axis) of different brain structures under hypoxia; G) Line plots between temperature (x-axis) and % of oxidative capacity of different brain structures; N = 3; Post hoc, *vs 25°C (0.05>p>1×10⁻⁴), **vs 25°C (1×10⁻⁴>p>1×10⁻⁷), #vs Normal (0.05>p>1×10⁻⁴), $Thalamus vs cortex (0.05>p>1×10⁻⁴), &Hippocampus vs cortex (0.05>p>1×10⁻⁴), NS: non-significant difference between temperatures covered with a solid line. Statistical characters were colored black for cortex, red for hippocampus or hypoxia, blue for thalamus and green for all brain structures.

