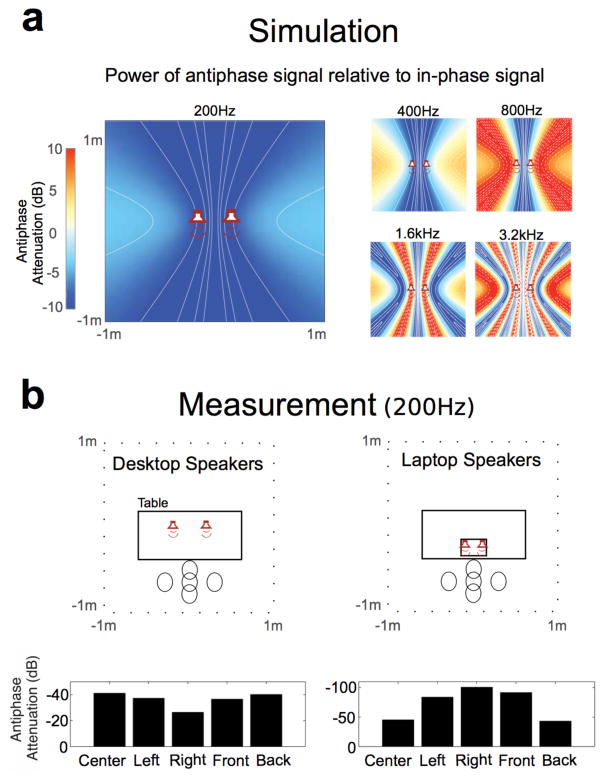
Fig. 2. Simulation and measurement of attenuation over space.
(a) Attenuation of anti-phase sinusoids simulated in free-field listening conditions with uniformly radiating speakers. We plot the computed attenuation over a 2m × 2m region centered on the speakers. In all subsequent attenuation plots we show the same plane and use the same color scale. This color scale is truncated; values exceeding −10dB are depicted at −10dB. Solid contour lines indicate negative values and dashed contour lines indicate positive values. The screening test works best at low frequencies, at which anti-phase signals are always attenuated. At higher frequencies the anti-phase signal is amplified in some locations and thus results could differ substantially depending on head position. (b) Measurement of anti-phase attenuation using desktop and laptop setups. For each setup a KEMAR head-and-torso simulator was placed in five locations as depicted. The laptop speakers were both closer together and closer to the listener. Attenuation was similar in the left and right ears; plots show attenuation averaged across the two ears.

