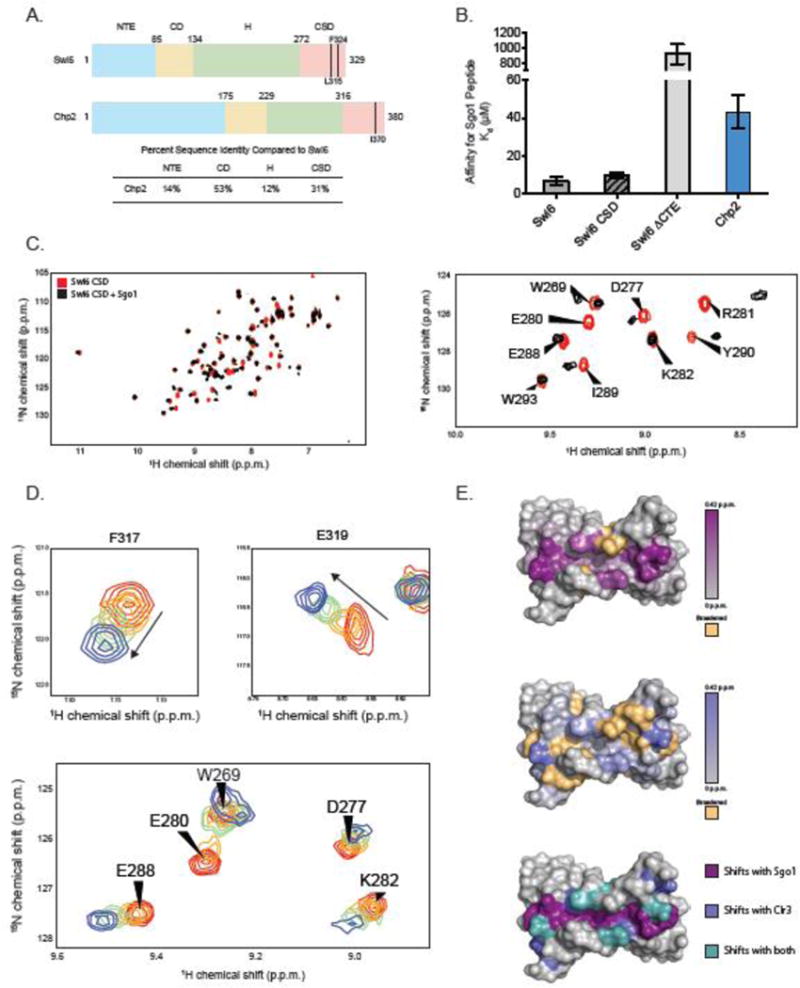
Figure 1.

(A) Domain schematic of Swi6 and Chp2 showing residue numbers and percent identity between the two proteins. Mutants used in these studies are indicated. Sequence identities were calculated using EMBOSS Needle. (B) Dissociation constants (Kd) for the Sgo1 peptide measured by fluorescence anisotropy. Experiments were carried out in triplicate at room temperature. (C) (Left) A superimposition of 1H-15N HSQC spectra of Swi6 CSD with (black) and without (red) Sgo1 peptide. (Right) A zoom of a subset of chemical shift perturbations. (D) 1H-15N HSQC spectra overlay of residues F317 and E319 while being titrated by the Clr3 peptide. Concentrations of peptide shown are 0 μM (red), 20 μM (orange), 80 μM (green), 500 μM (blue). (E) The Swi6 CSD crystal structure colored by chemical shift perturbation upon the addition of 2X molar ratio Sgo1 peptide (Top) and 5X molar ratio Clr3 peptide (Middle). Orange indicates resonances that were broadened beyond detection upon peptide addition (PDB 1E0B). (Bottom) The Swi6 CSD crystal structure colored by shifts observed with Sgo1 peptide (purple), Clr3 peptide (blue), and with both peptides (teal).
