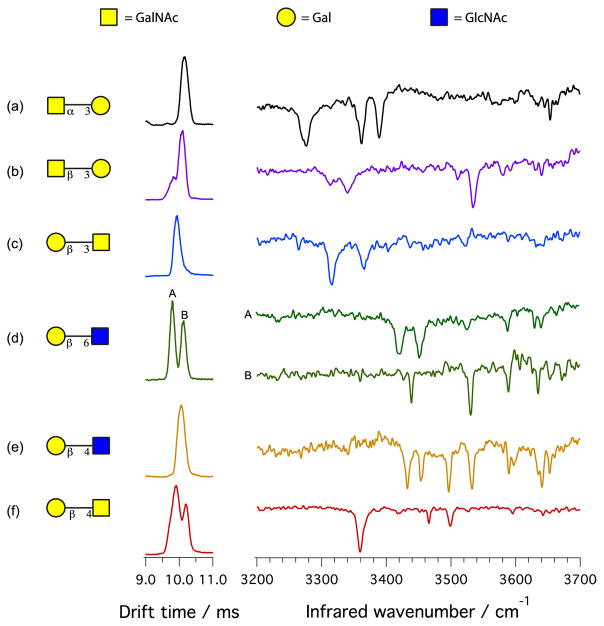
Figure 2.
Drift times and infrared spectra for six isomeric disaccharides. The structure of glycans is shown using the UOXF nomenclature [34]. Each disaccharide is complexed with a sodium cation, which is not shown in this representation. The (*) in the drift time distribution represents species with a mass different from the disaccharide.

