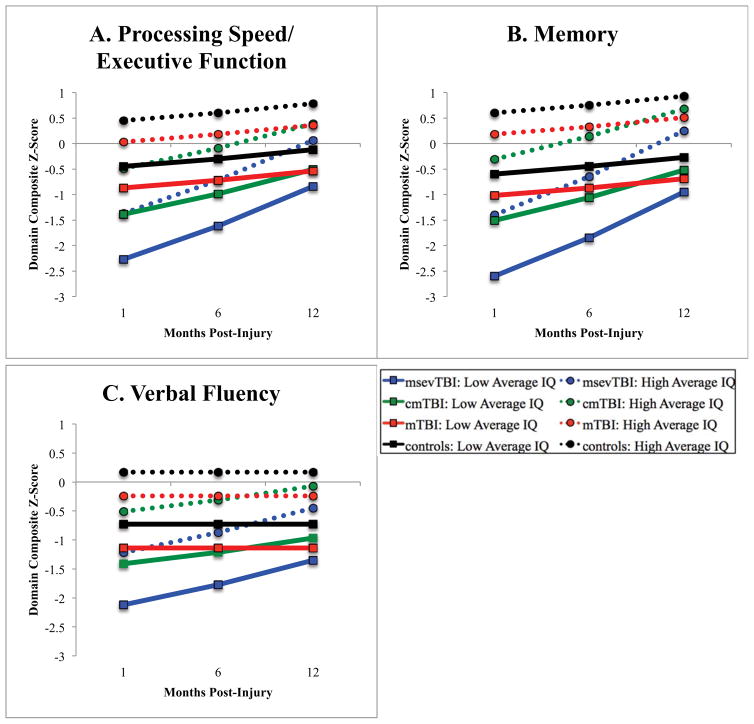
Figure 1.
Average cognitive recovery trajectories for each group split by estimated premorbid intelligence. Outcomes for each domain (Panels A, B, and C) are presented as z-scores, which are standardized values with a population mean of 0 and standard deviation of 1. WTAR-estimated IQ was dichotomized into high/low average categories (+/− 1 standard deviation from the population mean of 100) for the purposes of visualization only.

