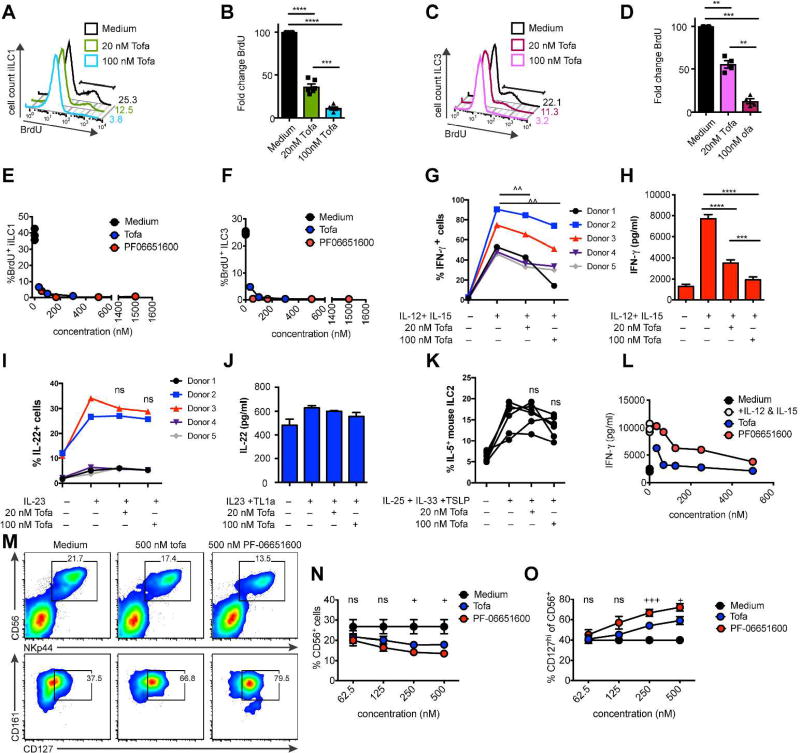
Figure 5. JAK3 inhibition impairs human ILC proliferation and differentiation.
(A–D) Effect of 48-hour tofacitinib and (E–F) PF-06651600 culture on BrdU incorporation in expanded (A–B, E) iILC1 and (C–D, F) ILC3. Data show (A,C) representative flow plots, (B,D) quantification, and (E–G) representative dose-response curves. (G–H) Effect of 48-hour tofacitinib culture on IFN-γ in expanded human tonsillar iILC1. Data show (G) percentage of IFN-γ+ cells and (H) representative IFN-γ protein in supernatant of Donor 3 by CBA. (I) Percentage of IL-22+ ILC3 cells after IL-23 stimulation ex-vivo in the presence of the indicated dose of tofacitinib. (J) Representative IL-22 protein in supernatant of expanded human tonsillar ILC3 after 48-hours of tofacitinib. (K) Percentage of IL-5+ mouse ILC2 after stimulation ex-vivo in the in the presence of the indicated dose of tofacitinib. (L) Representative dose-response curve of IFN-γ protein in supernatant of cells treated for 24 hours ex-vivo with tofacitinib and PF06651600. (M–O) Purified peripheral blood CD34+ cells were cultured in ILC-polarizing conditions for 14 days then incubated with the indicated concentration of tofacitinib and PF06651600. (M) Representative flow plots of differentiated human ILC. (N) Quantification of percent CD56+NKp44+ cells among lineage negative lymphocytes. (O) Quantification of percent CD127+ cells among CD56+NKp44+ cells. Data represent (A–D, G–J) n = 5 donors, (E–F, L) n= 2 donors, (K) n = 6 mice, or (M–O) n = 3 donors. ^p<.05, paired t-test. *p<.05, **p<.01, ***p<.001, ****p<.0001, one-way ANOVA with Tukey’s multiple comparison test. +p<.05, +++p<.001, ordinary oneway ANOVA.

