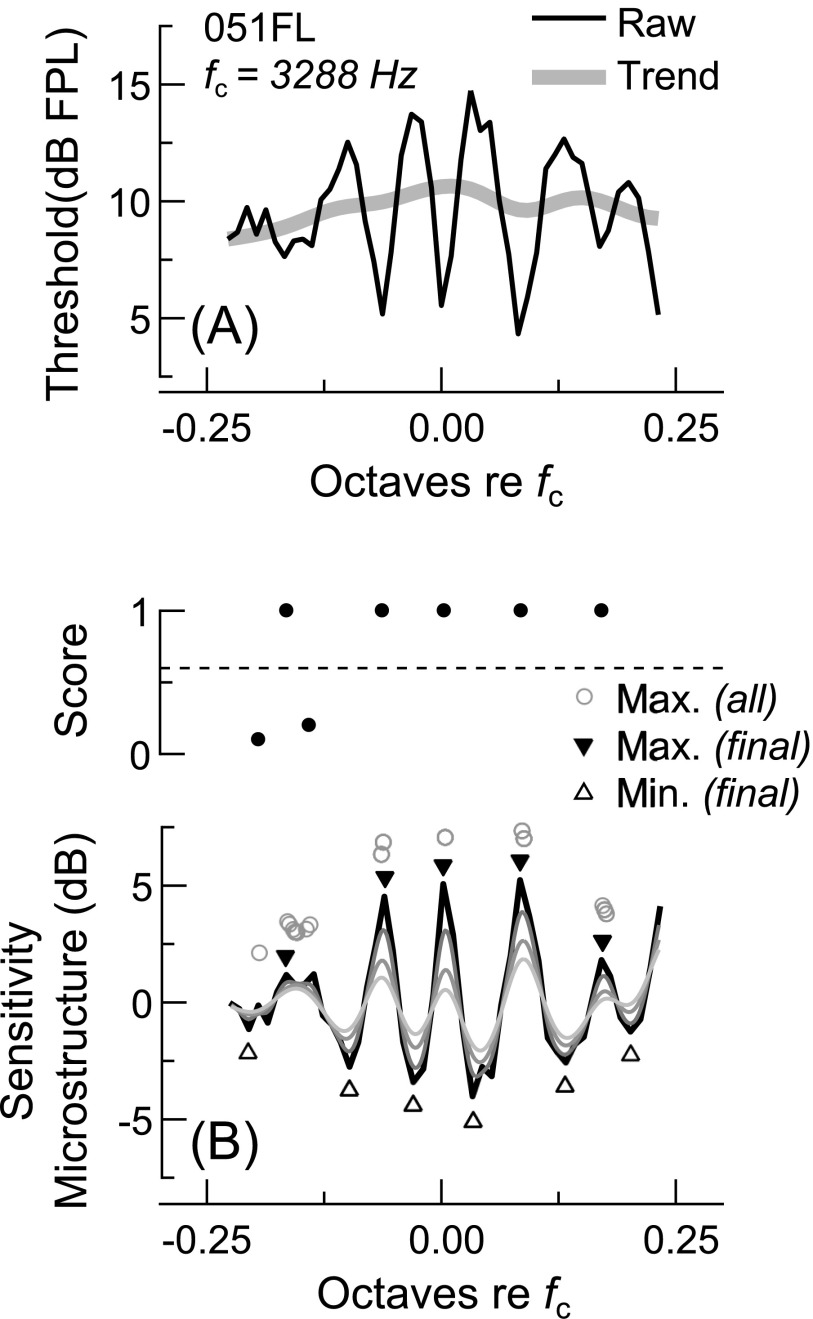
FIG. 1.
Microstructure extraction and analysis for subject 051FL. (A) Raw threshold measurements (thin line) were low-pass filtered with a fourth-order Butterworth filter (cutoff frequency = 7 cycles/octave) to determine the background trend (thick line). The trend was then subtracted from the raw thresholds to yield the microstructure. The threshold microstructure was then, was inverted and referred to as the sensitivity microstructure. (B) Sensitivity maxima and minima were determined by low-pass filtering the microstructure ten times (with cutoff frequency = 40 cycles/octave) and finding the zero-crossings in the derivative of the curve resulting from each filtering operation (thin dark-to-light curves show the microstructure filtered 2, 6, and 10 times). Each maximum identified after the first round of filtering was scored for robustness to further smoothing by calculating the fraction of the ten filtering operations after which an extreme was identified within 1/100-octave of its original frequency (all maxima identified after each filtering procedure are shown with circles). Maxima with scores greater than 0.6 [dashed line in top part of (B)] were kept in the analysis. The final frequency and magnitude of each maximum were taken as those of the maximum in the unfiltered microstructure curve occurring within 1/40-octave of its smoothed, filtered frequency (solid triangles). The most negative points occurring 1/10–1/80-octave below or above the maximum were identified as the associated low- and high-side minima (open triangles).

