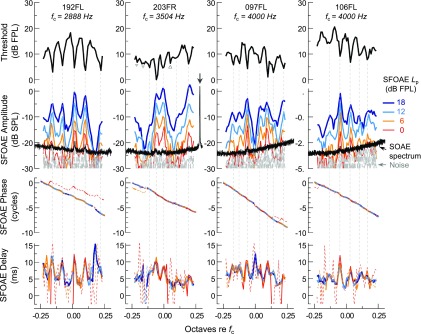
FIG. 2.
(Color online) Behavioral thresholds and SFOAE amplitudes, phases, and delays for four subjects. Subject identifiers and the center frequency () of each 0.46-octave range are shown at the top of each column. Dashed vertical lines illustrate the close frequency correspondence between threshold minima and peaks in SFOAE amplitudes and delays. Low-level SOAE peaks (black spectra) were also occasionally observed at these frequencies, though each was adjusted to avoid larger SOAEs (see arrow for subject 203FR in the second column). Vertical lines were not drawn for threshold minima with depths of less than 2 dB (open triangles) or for one minimum not meeting the criterion of the automated, objective microstructure-identification procedure (closed triangle) described in Fig. 1. Such frequencies were not associated with strong fluctuations in SFOAE amplitudes or delays. Dashed portions of the phase curves indicate data with SNR < 6 dB. For the delay curves, dashed portions indicate where the SNR was less than 6 dB at two or more of the three frequencies used to compute the delay. These plotting conventions are maintained in all subsequent figures.

