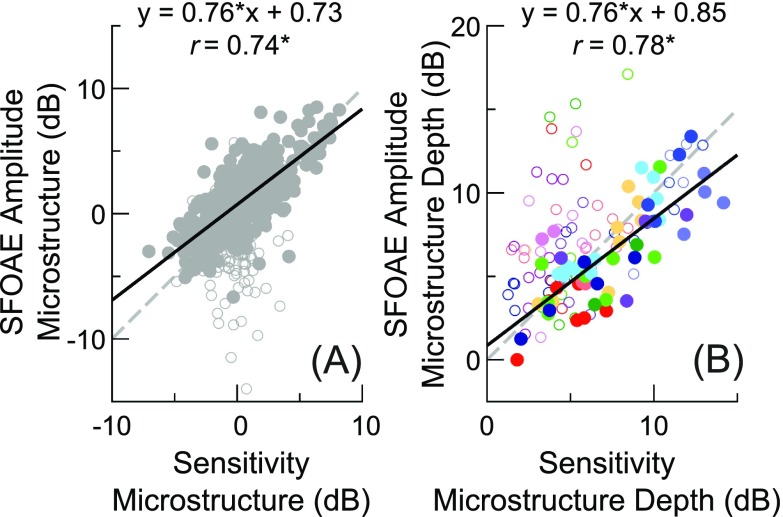
FIG. 5.
(Color online) (A) Comparison of sensitivity and SFOAE amplitude microstructure magnitudes across all frequencies and subjects (n = 564), using SFOAE data estimated for an Lp of 0 dB SL. Pearson correlation coefficients and linear regression fits (black lines) were computed only for data where the SFOAE SNR was at least 6 dB (filled symbols; n = 400). Open symbols indicate data not meeting the SNR criterion. (B) As in (A), but instead only showing the depth (level difference) for each identified sensitivity maximum-minimum pair versus the corresponding depth in the SFOAE amplitude microstructure (). The correlations and linear regression fit were computed only for data where the SNR at both the SFOAE maximum and minimum was at least 6 dB (n = 57). Asterisks indicate a significant () linear correlation and the dashed lines show unity slope. Symbol shades are used to distinguish data from different subjects in (B).

