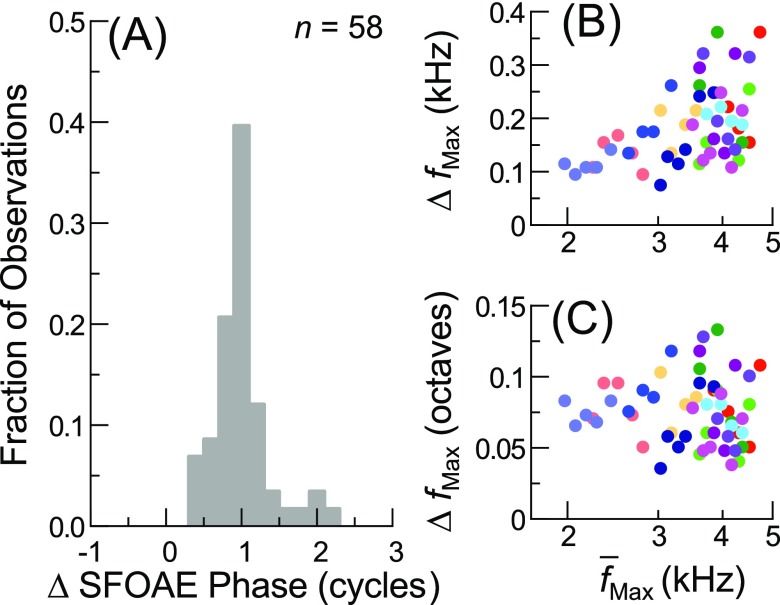
FIG. 6.
(Color online) (A) Histogram of the SFOAE phase accumulated between sensitivity microstructure maxima, using the phases from SFOAE responses for an Lp of 18 dB FPL (bin width = 0.2 cycles; n = 58 pairs of adjacent maxima). There is a clear peak at one cycle of phase accumulation. (B) and (C) The frequency difference () between adjacent sensitivity maxima in Hz (B) or octaves (C) plotted as a function of their geometric mean frequency. The absolute frequency difference increased with frequency, thus maintaining a relative spacing of roughly 10–20 cycles/octave, though both the absolute and relative spacings were variable overall, presumably due in part to variation in SFOAE phase gradients across frequency and ears.

