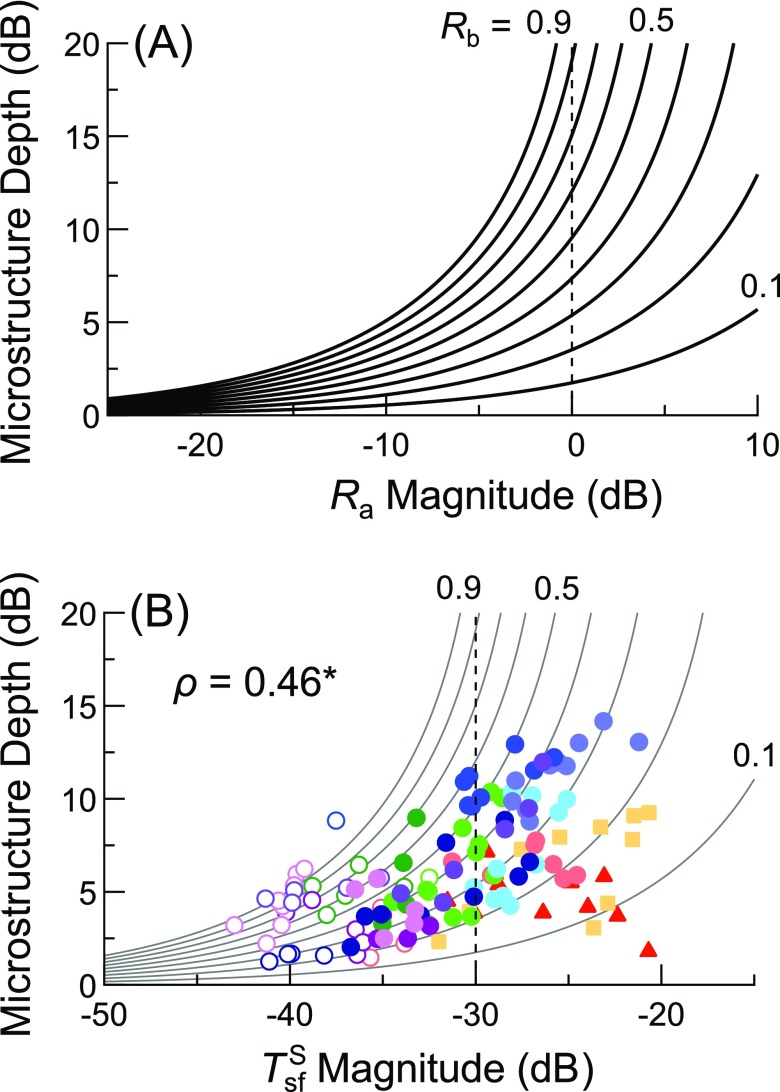
FIG. 7.
(Color online) (A) Theoretical dependence of microstructure depth on the magnitude of , as defined in Eq. (1), for values of ranging from 0.1 to 0.9 in 0.1 steps (values of 0.1, 0.5, and 0.9 are noted next to the appropriate curves). (B) Microstructure depth for each pair of adjacent sensitivity maxima and minima plotted versus the magnitude calculated at their geometric mean frequency, using SFOAE responses for an Lp of 0 dB SL. The Spearman's rank correlation coefficient (ρ) is shown for all points with an SFOAE SNR of at least 6 dB (filled symbols); asterisk indicates p < 0.0001. The curves from (A) are also shown after horizontally shifting them by −30 dB, an estimate of from Puria (2003). Vertical dashed lines indicate where (i.e., 0 dB).

