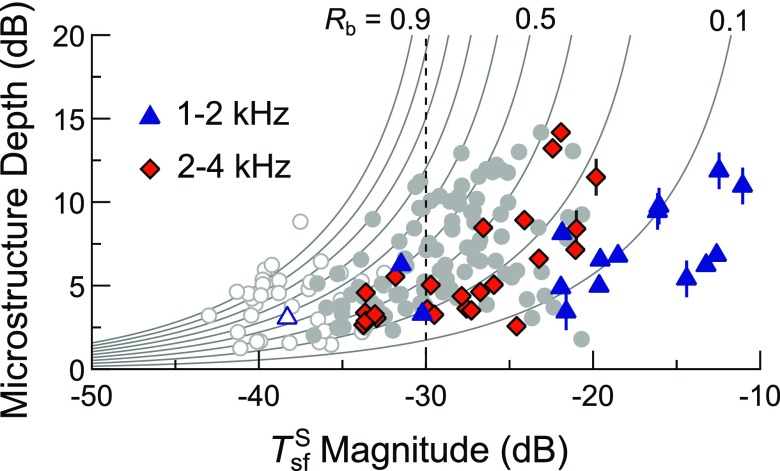
FIG. 8.
(Color online) Microstructure depth vs magnitude (for an Lp of 0 dB SL) for all maximum-minimum pairs observed between 1 and 4 kHz for one subject. The different distributions of data for maxima falling below and above 2 kHz (triangles and diamonds, respectively) suggest that the relationship between depth and varies with frequency, perhaps due to differences in and . Symbols marked with vertical lines indicate data for maxima associated with SOAEs greater than −10 dB SPL in amplitude. The data and theoretical curves from Fig. 7(B) (gray circles/curves) are shown for comparison. Dashed vertical line indicates where .

