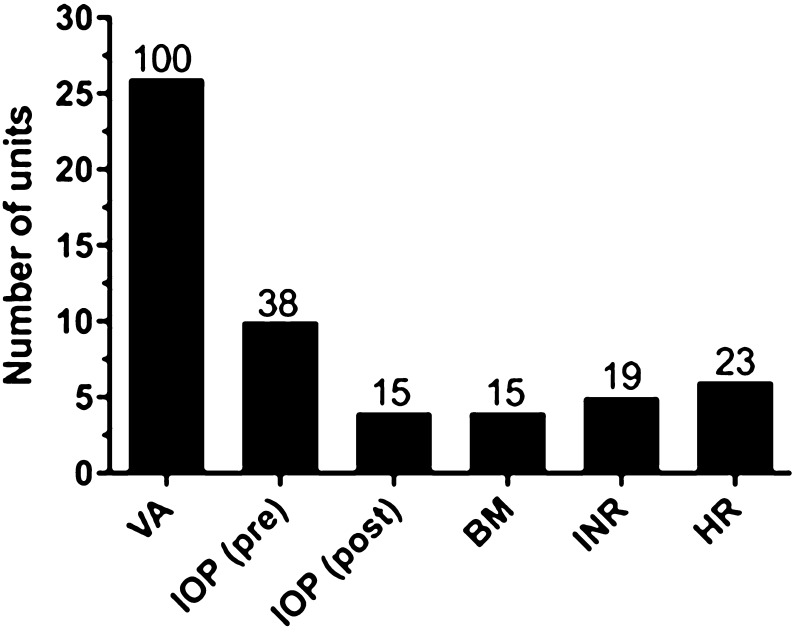
Fig. 3.
Clinical assessments performed at units at baseline and monitoring visits. Visual acuity (VA), n = 26 (100%) at baseline and monitoring. Intraocular pressure (IOP), n = 22 (25%) at baseline and n = 14 (54%) at monitoring. Slit-lamp biomicroscopy, n = 26 (100%) at baseline and n = 21 (77%) at monitoring. Fundus photography n = 15 (58%) at baseline and n = 8 (31%) at monitoring. Optical coherence tomography (OCT), n = 26 (100%) at baseline and monitoring. Fundus fluorescein angiography (FFA), n = 17 (65%) at baseline only. Quality of life (qol) questionnaire, n = 1 (4%) at baseline only. Percentage of respondents shown above each bar

