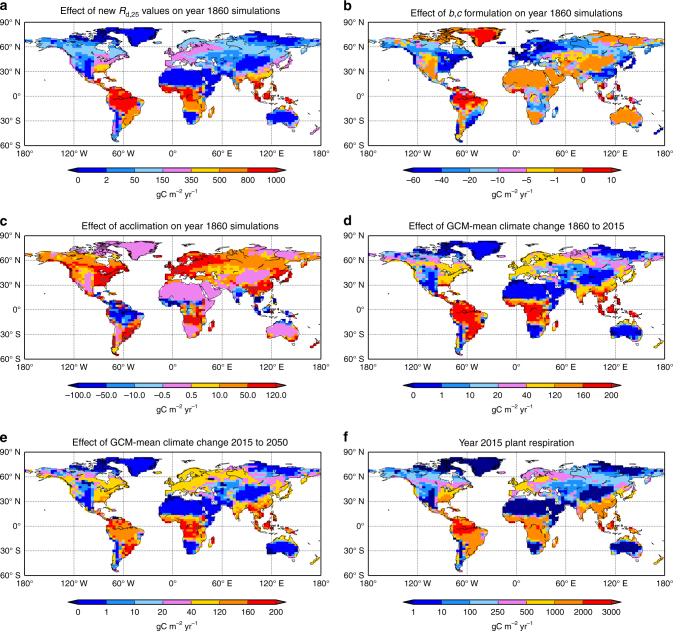
Fig. 2.
Gridbox-mean maps of total plant respiration for new processes and imposed climate change. Changes to R p as: a introduction of new R d,25 values: New_R d,25 minus Standard; b effect of new instantaneous T l response: New_R d,25_b,c minus New_R d,25; c effect of acclimation: New_R d,25_b,c_acclim minus New_R d,25_b,c; d effect of climate change to present, as year 2015 minus year 1860 and new processes New_R d,25_b,c_acclim; e similar to d, but year 2050 minus year 2015. Panel f actual 2015 values of New_R d,25_b,c_acclim. Scales different between panels to highlight effects. Units are SI. Panels d–f are means across the 34 GCMs emulated

