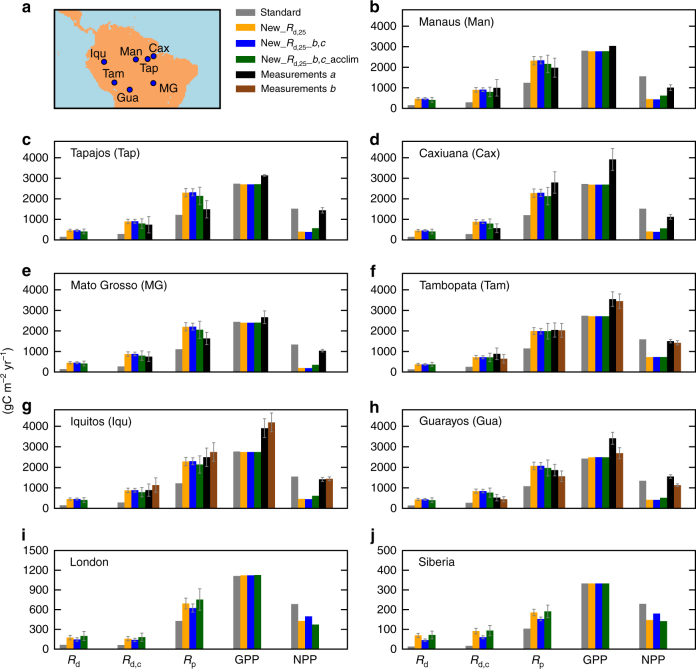
Fig. 3.
Respiration and primary productivities (gross as GPP and net as NPP) at selected locations during modelled year 2015. Seven locations (details in Methods) a are South American b–h, along with i for gridbox containing London, UK, and j is in Siberia, Russia (Lat 70 N, Lon 82.5 E). Shown for dominant plant functional type (PFT) at each site, left to right, for each histogram cluster: upper canopy leaf-level respiration (with light inhibition) R d, whole canopy-level respiration R d,c, total plant respiration R p, GPP and NPP. Each histogram cluster are four estimates: Standard, New_R d,25, New_R d,25 _b,c and New_R d,25 _b,c_acclim. South America sites, 5th (or 6th) column are measurements. Dominant PFTs: b–h BTs, i grasses, j shrubs. Uncertainty bounds of ± one s.d. are presented which for model estimates are from data-based upper canopy leaf-level uncertainty estimates, subsequently propagated through the model. For measurements, these bounds are taken from the literature

