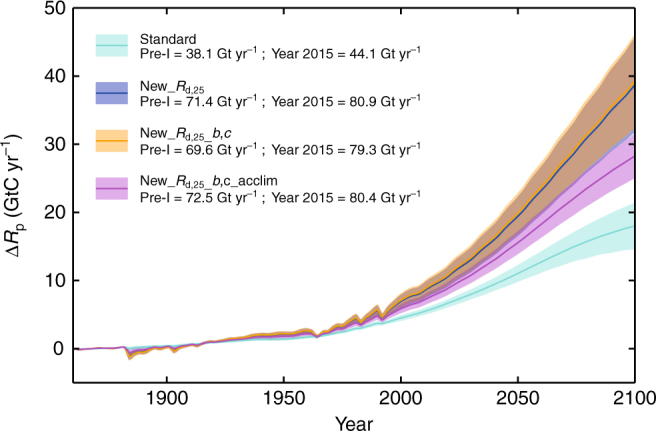
Fig. 4.

Time series of change in areally-averaged global respiration. Presented are time-evolving model estimates of change in total whole-plant respiration, ΔR p. The colours of turquoise, blue, yellow and magenta are Standard, New_R d,25, New_R d,25_b,c and New_R d,25_b,c_acclim respectively. Where yellow and blue projections overlap, the colour is brown. The spread corresponds to the different projections of climate drivers, based on the 34 Global Circulation Models (GCMs) emulated in the Integrated Model Of Global Effects of climatic aNomalies (IMOGEN) modelling system and for RCP8.5 scenario. The continuous lines are the mean, and the spread as ± two s.d. which broadly covers inter-GCM spread. Pre-industrial (marked Pre-I) and year 2015 model mean absolute estimates of R p are as annotations
