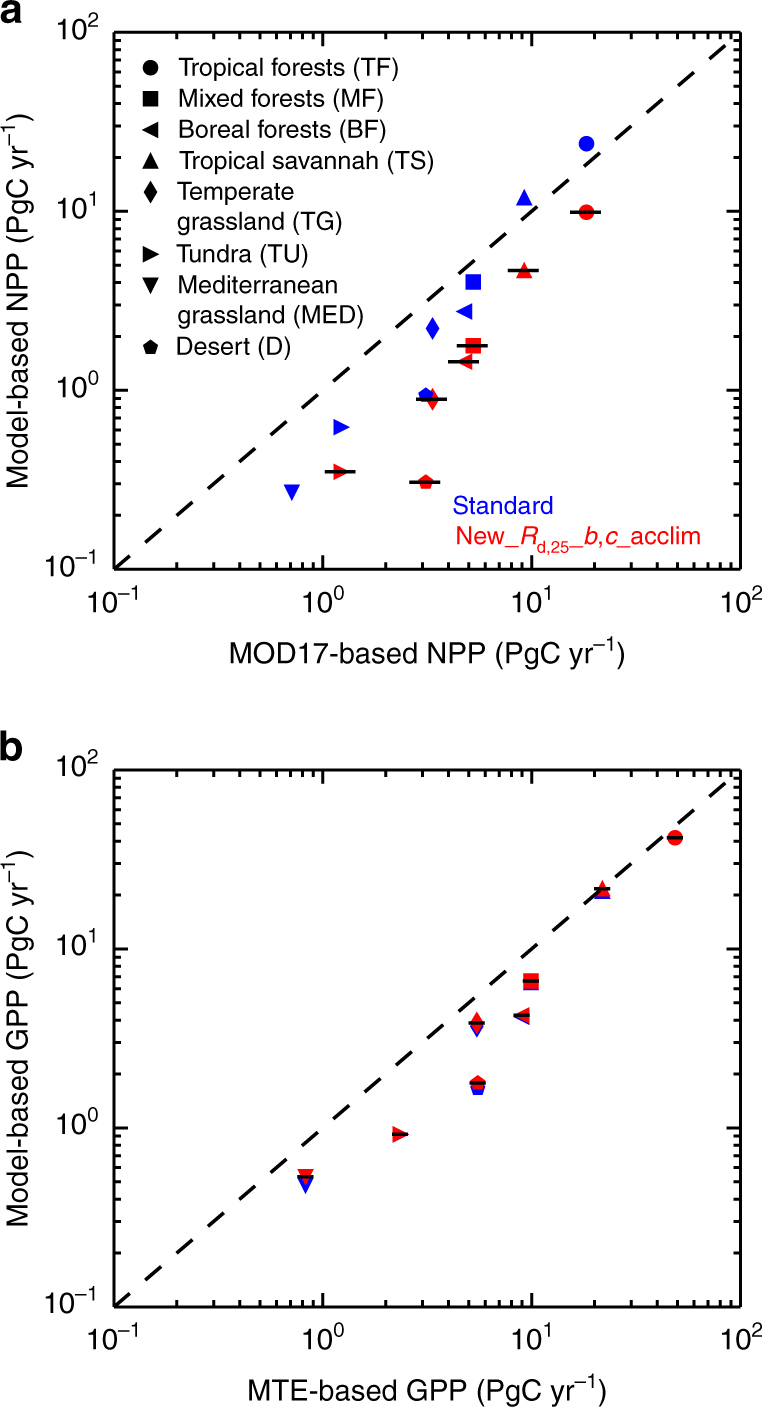
Fig. 5.

Data- and model-based global estimates of net primary productivity and gross primary productivity for different biomes. a Global measurements of total annual mean net primary productivity (NPP), average for years 2000–2011, and using Earth-observed MODerate-resolution Imaging Spectroradiometer (MODIS) measurements. Values are spatially aggregated for different World Wildlife Fund (WWF) biome classifications. The dominant biome type at each location is linked to NPP with the MOD17 algorithm applied to MODIS values (horizontal axis). Similarly gridbox-mean JULES estimates of NPP are multiplied by gridbox area, and combined for each WWF biome (vertical axis). This is dependent upon which WWF biome is dominant for the grid location. Note logarithmic axes. JULES NPP estimates are slightly negative for Mediterranean grasslands and so off axes. b Similar calculation for gross primary productivity (GPP), with measurements from the Model Tree Ensemble (MTE) algorithm. Both panels, model values presented in blue for standard JULES version (i.e., Standard simulation), and in red for new R d,25 values with b,c temperature response and acclimation (i.e., New_R d,25 _b,c_acclim simulation). For GPP, differences are small between two model forms, with red symbols overlapping blue symbols. Uncertainty bounds on NPP and GPP data are the small black horizontal bars ( ± one s.d.), shown for red symbols only. All calculations include only land points with less than 50% agriculture
