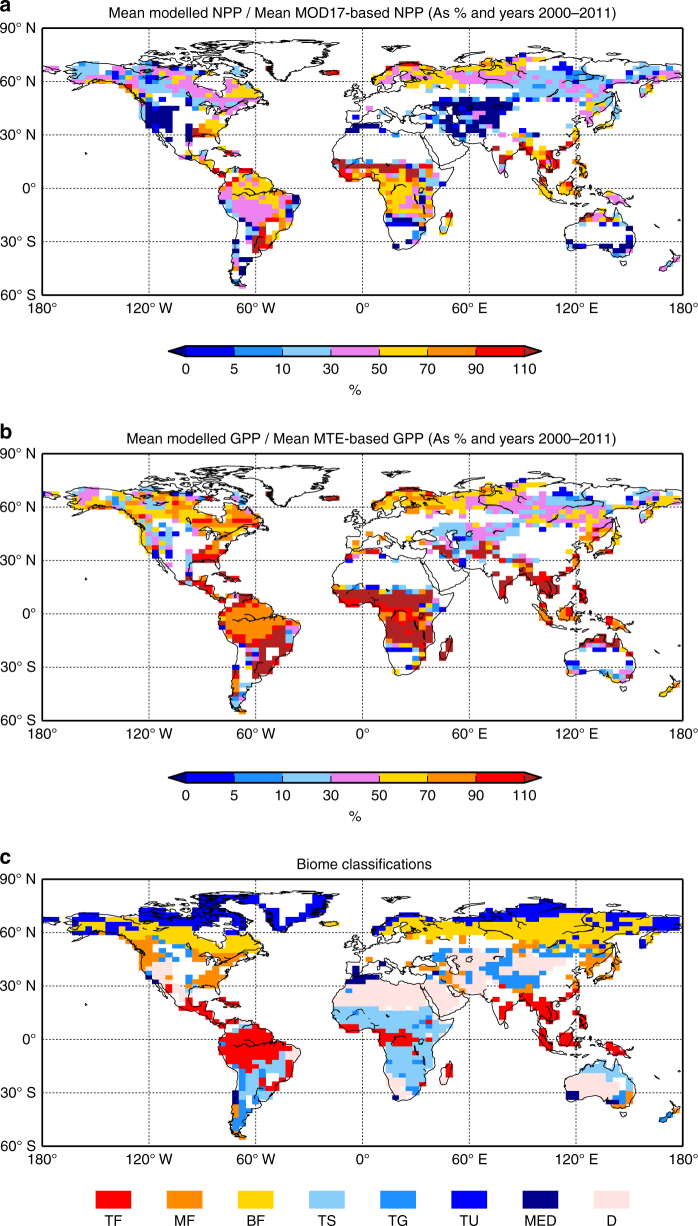
Fig. 6.
Data- and model-based maps of comparison of net primary productivity and gross primary productivity for different biomes. a Map of JULES estimates of annual NPP, average for year 2000-2011 divided by MODIS NPP algorithm (MOD17) estimates for the same period. Values multiplied by one hundred to express as percentage. Land points excluded are those with >50% agriculture, and also where values are very small (if absolute value of JULES or MODIS NPP is less than 1 gC m−2 yr−1). b Similar to (a) but for GPP, and data based on upscaled FLUXNET GPP from the MTE algorithm. Again, land points excluded are those with > 50% agriculture, and those with small values (if value of JULES or MTE-based GPP is less than 1 gC m−2 yr−1). Panel c is map of dominant biome, and labels identical to Fig. 5

