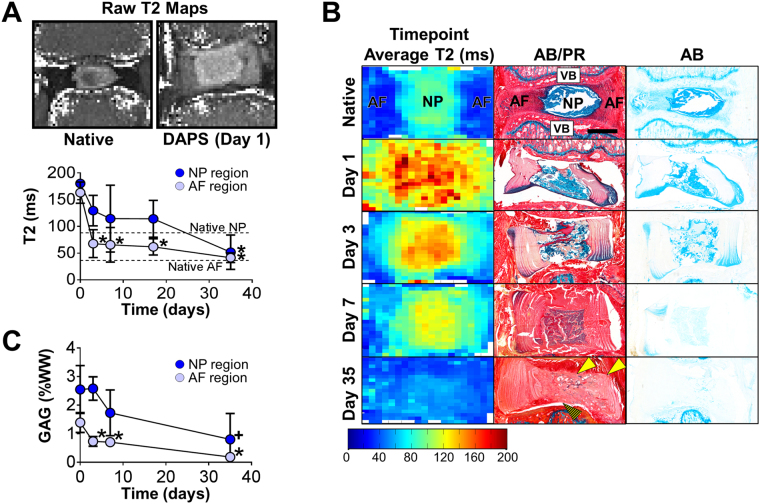
Figure 3.
In Vivo DAPS Implantation: Immature Constructs (continued). (A) Raw T2 maps and quantification: T2 MRI mapping was performed over the 5-week implantation period, and the T2 relaxation time (indicative of water and GAG content) was calculated after manual segmentation of the AF and NP regions. Both the AF and NP T2 decreased significantly after implantation (*p < 0.05 vs. day 1). (B) Comparison of MRI and histology: Time point average T2 maps (left column) were generated and compared to Alcian blue (AB)/picrosirius red (PR) stained histological sections (middle column) and AB-only stained sections (right column). Corresponding with the decrease in T2, AB-positive staining decreased over time in both the AF and NP. Remodeling to the NP region took place over this same time period, with the NP transitioning from a PG-rich to collagen-rich state over 5 weeks. There was evidence of DAPS integration into native soft tissue (solid arrows) but not into adjacent vertebrae (striped arrow). Scale: 1 mm. (C) GAG quantification: GAG depletion in both the AF and NP regions was confirmed by direct measurement (*p < 0.05 vs. day 1, + p < 0.1 vs. day 1).

