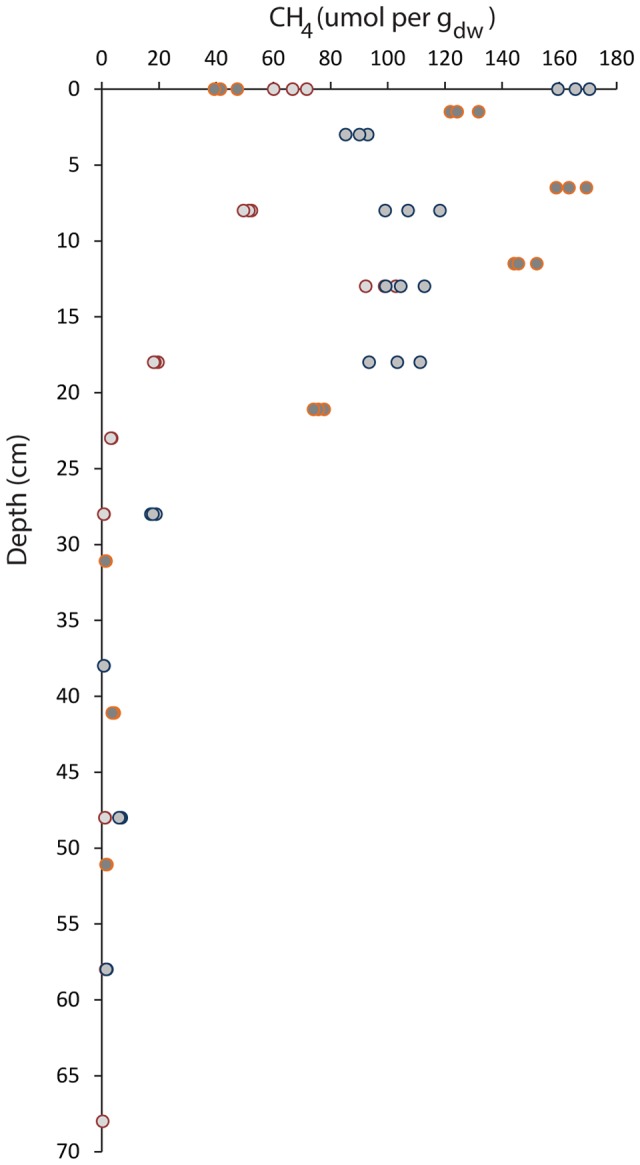
FIGURE 1.

Vertical profile of methane concentrations along the depth gradient of the paddy field soil. The soil depth is depicted vertically, and the methane concentration in μmol per gdw is depicted horizontally. Three separate cores were sampled up to the maximum depth of 68 cm. Measurements of each sample were performed in triplicate by gas chromatography.
