
FIGURE 3.
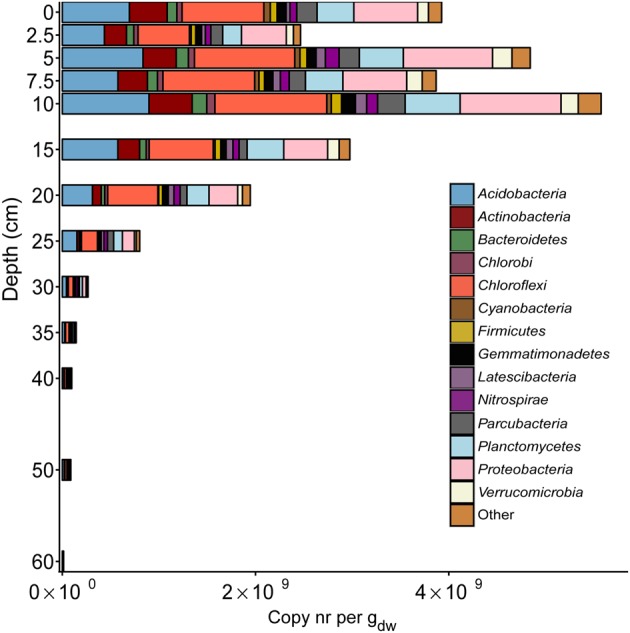
Distribution of 16S rRNA gene reads of major bacterial phyla along the depth profile of the paddy soil core. The soil depth in centimeters is depicted vertically, whereas the total amount of 16S rRNA gene amplicons per gram dry weight is depicted horizontally. The colored bars represent the relative amount of gene copies matching a bacterial phylum present in the soil at a particular depth.