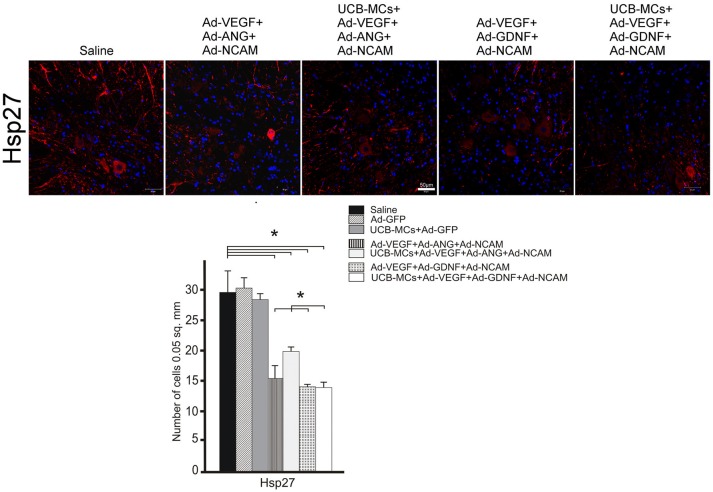
Figure 6.
Hsp27 expression. Upper panel: Immunofluorescent staining of the caudal spinal cord cross sections with Abs against Hsp27 (red) caudally to the site of injury in control (Saline) and therapeutic groups. Nuclei (blue) were counterstained with DAPI. Scale bar = 50 μm. Lower panel: Histogram of the statistical analysis of Hsp27-positive cells number in VH zone. Data are presented as mean SEM, *p < 0.05 (one-way ANOVA).

