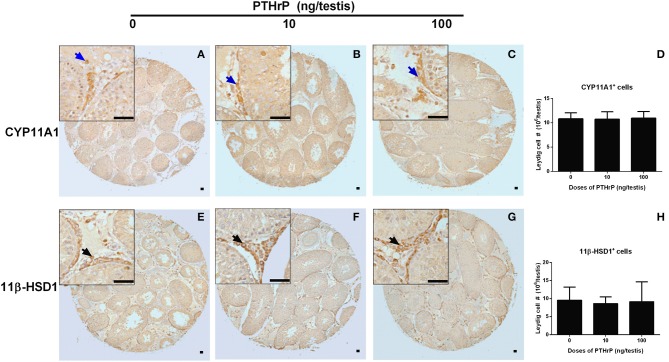
Figure 6.
Morphology of Leydig cells in the testes after in vivo PTHrP treatment. Immunohistochemical staining of CYP11A1 (A–D) and 11β-HSD1 (E–H) of the testes from the rats treated with 0, 10, and 100 ng/testis PTHrP on post-EDS day 7 for 21 days. (A,E): the control (0 pmol/testis PTHrP); (B,F): 10 ng/testis PTHrP; (C,G): 100 ng/testis PTHrP; (D,H): quantitative data. Blue arrow indicates CYP11A1 positive Leydig cells. Black arrow indicates 11β-HSD1 positive Leydig cells. Bar = 50 μm. Mean ± SEM, n = 6. No significant difference between PTHrP group and the control was observed.

