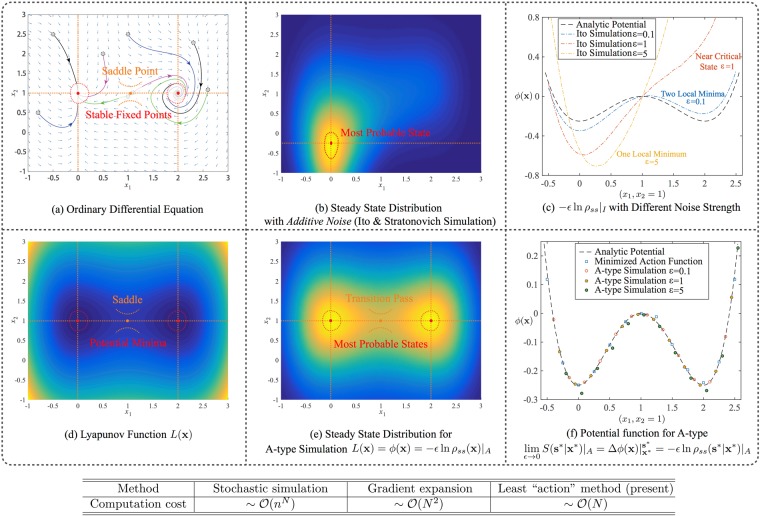
Figure 1.
The modeling results on the potential (Lyapunov) function and steady-state distribution for an illustrative example with additive noise. Top panel: the prevailing stochastic simulation leads to a deviated stability structure. Bottom panel: The Lyapunov function, A-type simulation and potential function by least action method consistently reveal stability structure. (a) Vector field showing two stable fixed points and one saddle point. (b) Steady-state distribution by Ito’s (Stratonovich’s) simulation of SDE with ε = 1, where positions of fixed points from ODE and bistable topology are altered by large noise. (c) Deviations on potential values along the line x2 = 1 between the analytical construction and Ito’s simulation of SDE with noise strengths ε = 0.1, 1, 5. (d) Lyapunov function for ODE. (e) Steady-state distribution by A-type simulation of SDE with ε = 1, where positions of fixed points and bistable topology are consistent with those from ODE and Lyapunov function. (f) Potential values along the line x2 = 1 calculated by least action method, and A-type simulation of SDE with noise strengths ε = 0.1, 1, 5. Parameters are: d = a = H = 1. Table: computational costs of the methods on calculating potential barrier between fixed points with respect to system’s dimension N, where n is the number of mesh points in each dimension for stochastic simulation.

