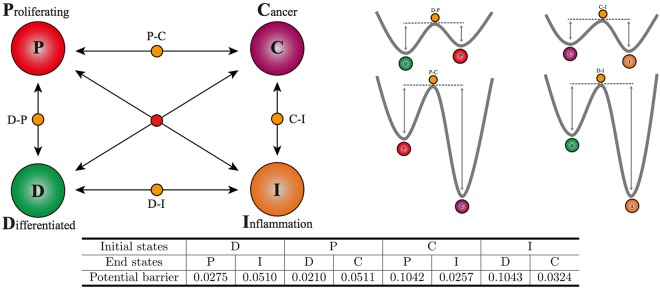
Figure 2.
Potential barriers calculated by Protocol II in the prostate cancer model11. Left panel: The chosen four cell states: differentiated (D), proliferating (P), cancer (C), inflammation (I). They are stable fixed points obtained from ODE of the 38-dimensional system. The states D-P, D-I, C-I, P-C are saddle points, and the red fixed point in the middle is unstable. Right panel: the heights of potential barriers between stable fixed points connected by saddles. The lengths of arrows are proportional to barrier heights listed in the table below. Table: potential barriers between stable fixed points are calculated by the least action method. We set K = 100, T = 20, and have checked that larger K and T values lead to convergent results. The parameters of the system chosen here are for typical cancer patients11, where cancer and inflammation states are more stable.

