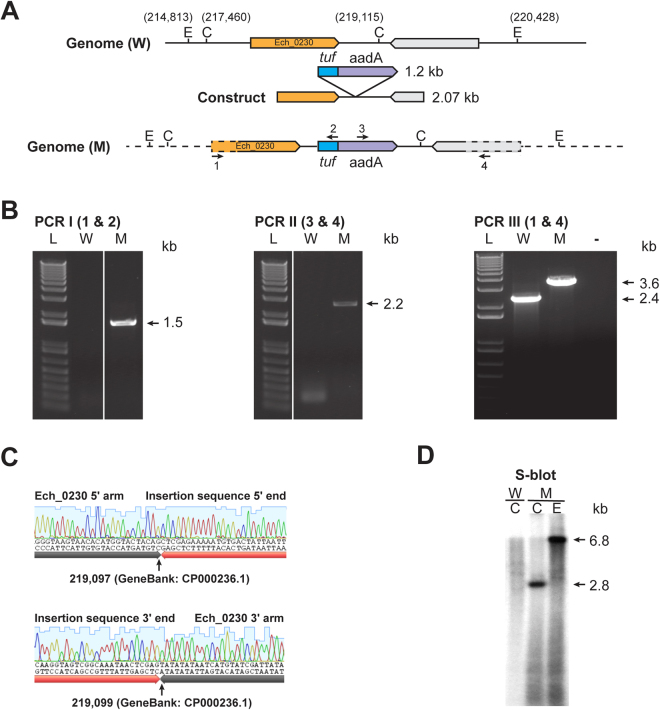
Figure 2.
Targeted allelic exchange mutagenesis to disrupt Ech_0230 gene. (A) An illustration depicting the genomic segment spanning the region selected for preparing allelic exchange construct, including the restriction enzyme sites {EcoRI (E) and ClaI (C)} used for the mapping the insertion. Genomic coordinates for restriction enzyme sites and the size of inserted fragment (tuf-aadA) were included to allow determination of the expected DNA sizes in PCR and Southern blot analysis. (B) Amplicons resolved following three different PCRs using primers targeting to the genomic regions upstream and downstream to the allelic insertion (primers identified as 1 and 4) and to the inserted DNA (primers; 2 and 3). (L, 1 kb plus molecular weight DNA markers; W, PCR with wild type genomic DNA as the template; M, PCR with mutant genomic DNA as the template). (C) PCR DNA Sequence verification of insertion sites in the targeted mutant. DNA sequence generated from amplicons (panel B); sequence shown above black arrow lines represents the sequence from E. chaffeensis genome, while the sequence above the orange arrowhead lines represents the inserted sequence in the gene disruption mutant. Sequences boundaries at the 5′ and 3′ insertion junctions were identified with a small black arrow lines. (D) Southern blot analysis of genomic DNAs (W and M) digested with ClaI (C) or EcoRI (E). The blot analysis was performed with aadA gene segment as the probe. (Full-length gels and blots were included in the Supplementary Figure file, as parts of the Figure had cropped images).

