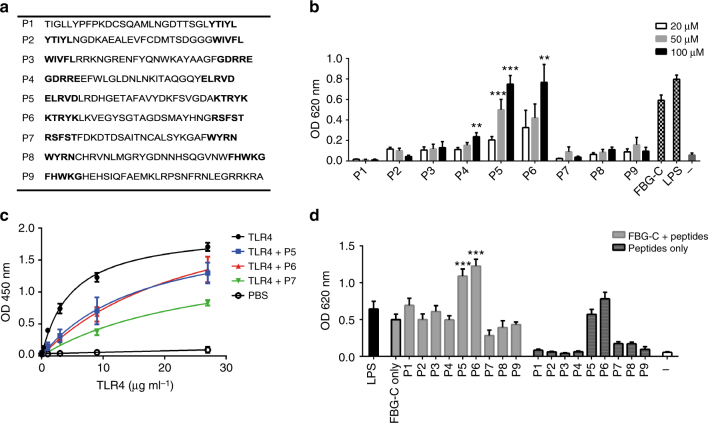
Fig. 2.
Peptide mapping reveals specific regions in FBG-C involved in TLR4 activation and binding. a Nine peptides of ~30 amino acids long from FBG-C were synthesized; overlapping amino acid sequences are shown in bold. b THP1 NF-kB cells were stimulated with LPS (0.5 ng ml−1), FBG-C (0.5 µM), or 20, 50, or 100 µM of peptides 1–9 for 24 h and NF-kB activation was measured using QUANTI-Blue™. Data shown as mean ± SEM, n = 4 independent experiments. One-way ANOVA vs. unstimulated cells. **p < 0.01, ***p < 0.001. c Increasing doses of TLR4 were pre-incubated with 200 µM of peptides before adding them to 96-well plates coated with 1 µg ml−1 of FBG-C. Curves were fitted in GraphPad Prism using one-binding site hyperbola equation. Data are shown as mean ± SEM, n = 3. d THP1 NF-kB cells were left unstimulated (−) or pre-incubated with 100 µM peptides prior to stimulation with 0.5 µM of FBG-C for 24 h. NF-kB activation was measured using QUANTI-Blue™. Data shown as mean ± SEM, n = 3 independent experiments. Paired t-test vs. FBG-C only, *p < 0.05, **p < 0.01, ***p < 0.001

