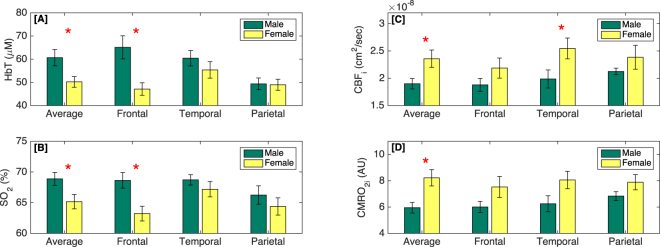
Figure 3.
The sexual differences in cerebral hemodynamics represented with bar graphs, reporting the mean values and standard errors across infants. The green bars indicate males; yellow bars, females; and the red stars indicate the locations where there is statistically significant difference between males and females. The x-axis shows the site of measurement: the average over all locations, frontal, temporal, and parietal lobes. [A] Total hemoglobin concentration (HbT). [B] Oxygen saturation (SO2). [C] Cerebral blood flow index (CBFi). [D] Cerebral oxygen metabolism index (CMRO2i).

