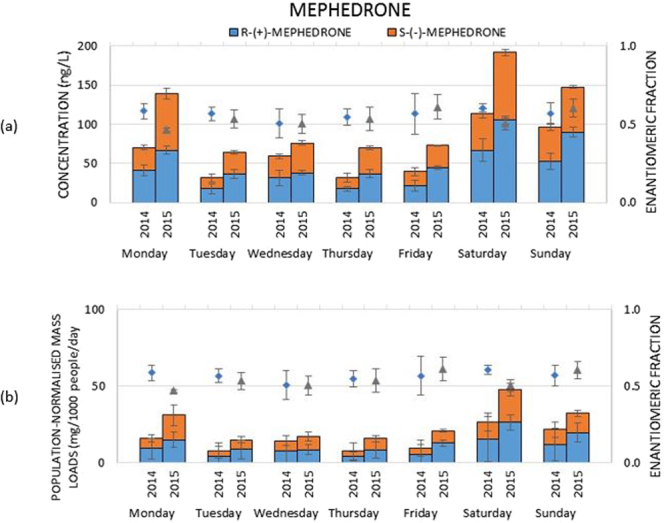
Figure 1.

Mephedrone in a week monitoring program. Results are displayed as concentrations (columns) in (a), population normalised-loads (columns) in (b) and enantiomeric fractions (symbols). The unpaired t-test showed “t Stat > t Critical one-tail” for all wastewater samples excluding Wednesday in 2014 (8.80 > 4.78), p one-tail (0.000024) < 0.001 and for all wastewater samples excluding Monday in 2015 (2.83 > 2.01), p one-tail (0.018) < 0.05. Therefore, EFs from wastewater samples were significantly different (EF > 0.5) from EF = 0.5 during validation. Paired t-test results showed “t Stat < t Critical one-tail” (1.14 < 1.94), p one-tail (0.15) > 0.05, so two datasets of wastewater samples were not significantly different from each other.
