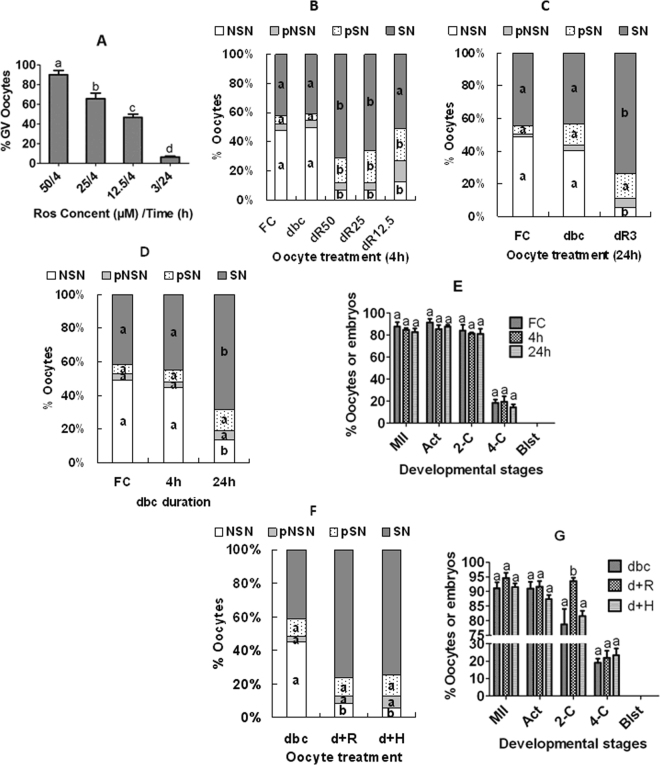
Figure 6.
Effects of MAM of prepubertal COCs or DOs with roscovitine or H89 in the presence of db-cAMP on GVBD, chromatin configuration and developmental potential. Panel A shows percentages of GV-intact oocytes following MAM of COCs for 4 h with 50 (50/4), 25 (25/4) or 12.5 (12.5/4) µM roscovitine or for 24 h with 3 µM roscovitine (3/24). Panels B and C show percentages of oocytes with different chromatin configurations after MAM of COCs with db-cAMP and/or different concentrations of roscovitine for 4 and 24 h, respectively. Panels D and E show percentages of oocytes with different chromatin configurations and embryo development, respectively, after MAM of DOs with db-cAMP for different times. Panels F and G show percentages of oocytes with different chromatin configurations and embryo development, respectively, after MAM of COCs with roscovitine or H89 with or without db-cAMP for 12 h. FC: freshly collected oocytes; dbc: 100 µM db-cAMP alone; dR50, 25, 12.5 and 3: 100 µM db-cAMP plus 50, 25, 12.5 or 3 µM roscovitine, respectively; d+R and d+H: 100 µM db-cAMP plus 6 µM roscovitine or 5 µM H89, respectively; MII: metaphase II/cultured oocytes; Act: activated/MII oocytes; 2-C: 2-cell embryos/activated oocytes; 4-C: 4-cell/2-cell embryos; Blst: blastocyst /4-cell embryos. Each treatment was repeated 3–5 times with each replicate including about 30 oocytes. a-d: Values with a different letter above bars differ significantly (P < 0.05).

