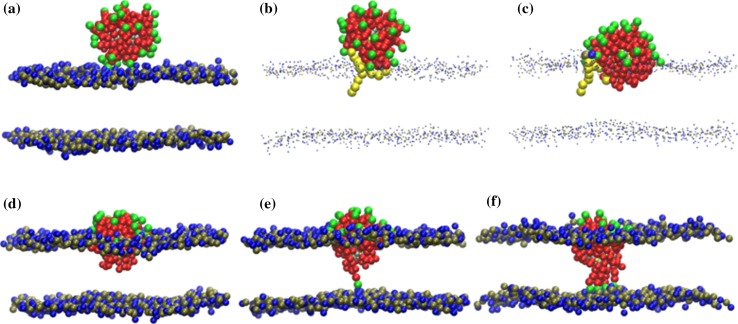
Fig. 9.
Stages of NP translocation through a biological membrane: a stage 1, adsorption of the NP at the membrane surface; b–d stage 2, the protrusion of a lipid tail initiates the hydrophobic contact that leads to partial embedding of the NP in the membrane core; e, f stage 3, the NP “snorkels” ligands to bind with the opposite leaflets (one and five anchors shown). The NP hydrophobic ligand chains are represented as red beads, and the charged NP ligand head-groups are represented as green beads. Lipid head-groups (choline) are shown as blue beads, while tan beads represent phospholipid phosphate groups. Water molecules and membrane phospholipid tails are not shown, except in b and c, where only the hydrophobic tails of the protruding lipid are represented by yellow beads. All snapshots refer to a MUS:OT 1:1 random NP. [Reproduced with permission from (Simonelli et al. 2015). Copyright (2015) American Chemical Society]

