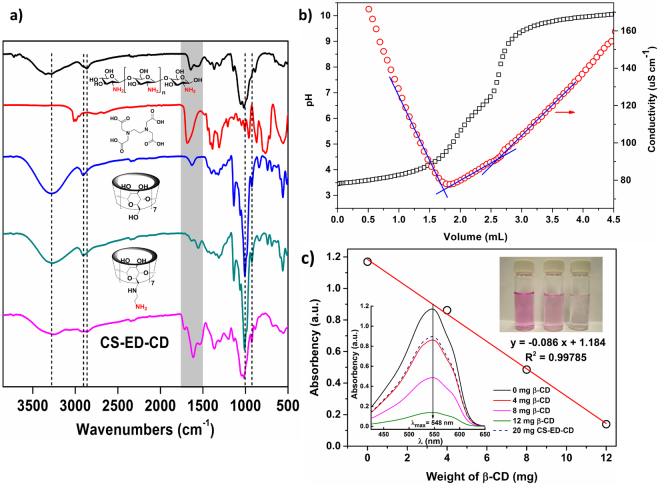
Figure 2.
(a) FTIR spectra of CS-ED-CD polymer and monomers. Spectra are labelled by chemical structure or compound name (top to bottom: chitosan, EDTA, β-CD, and amino-β-CD); (b) simultaneous conductometric-potentiometric titration curves of CS-ED-CD; (c) quantitative analysis of active β-CD cavities by photometric titration. Insert, bottom left: UV adsorption spectra of alkaline phenolphthalein solution treated with varying amount of pristine β-CD and 20 mg CS-ED-CD; top right: original alkaline phenolphthalein, treated with 20 mg CS-ED-CD, and treated with 12 mg pristine β-CD (from left to right).

