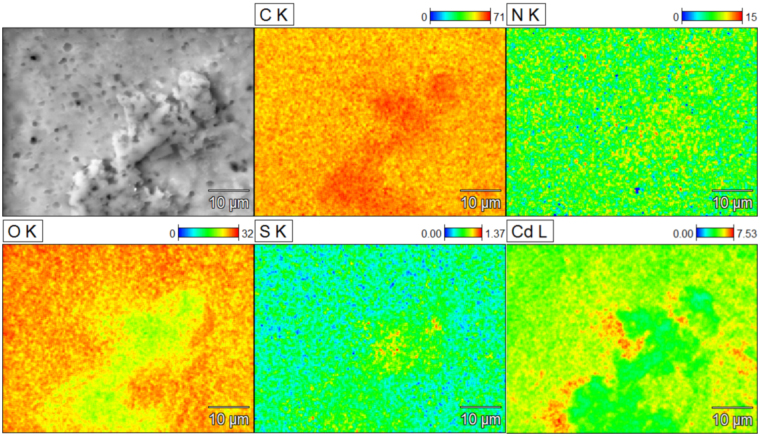
Figure 8.
SEM image and the EDS elemental distribution mapping of CS-ED-CD after simultaneous adsorption of Cd(II) and BPS (initial concentration: 100 mg L−1). The element of S acts as the indicator of BPS since only BPS contains sulphur. The signal spots of sulphur correlated with those of carbon and nitrogen. The distribution of Cd(II) coincided with the signal spots of oxygen, especially in the area of low oxygen signal there was lower Cd(II) loading.

