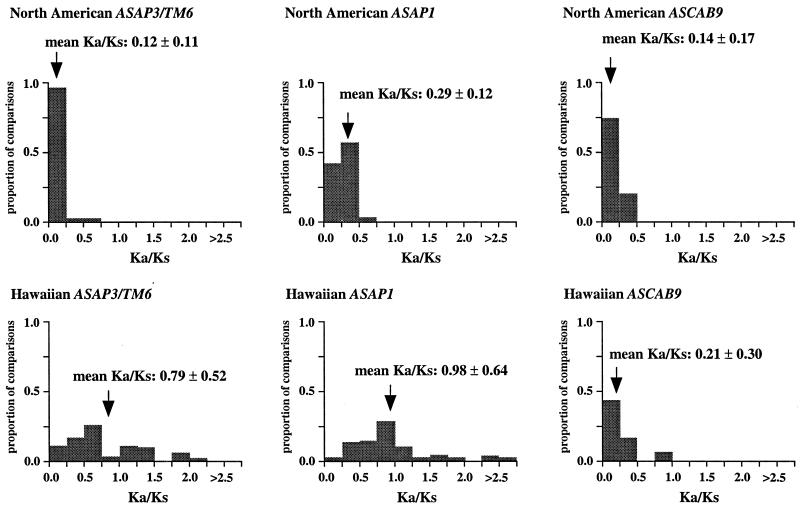
Figure 2.
Distribution of Ka/Ks values for the ASAP3/TM6, ASAP1, and ASCAB9 genes in the North American tarweeds and Hawaiian silversword alliance. Mean values and standard deviations are indicated. Pairwise comparisons that had no synonymous substitutions are not shown in the histograms and were not included in the analyses. Individual pairwise Ka and Ks estimates are shown in Tables 2–11, which are published as supplemental data on the PNAS web site.

