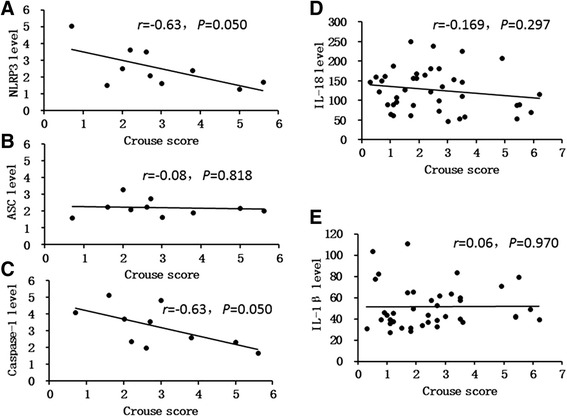
Fig. 1.

Correlation between NLRP3 inflammasome component genes expression, downstream cytokinesons and the Crouse scores. a, b and c NLRP3 mRNA、ASC mRNA、Caspase-1 mRNA expression in PBMCs of T2DM + CAS patients show negative correlation to Crouse scores separately. d and e Serum IL-18 concentrations were negatively correlated with the Crouse scores evidently, but Serum IL-1β concentrations were not
